

I often want to visualize my Oracle APEX app’s data model as an Entity/Relationship diagram to remind myself how tables are related and exactly how columns are named. After recently stumbling on the open source Mermaid JS project, I had a lightbulb moment and set out to build my own data model visualizer app with APEX itself.
Mermaid Diagram Syntax
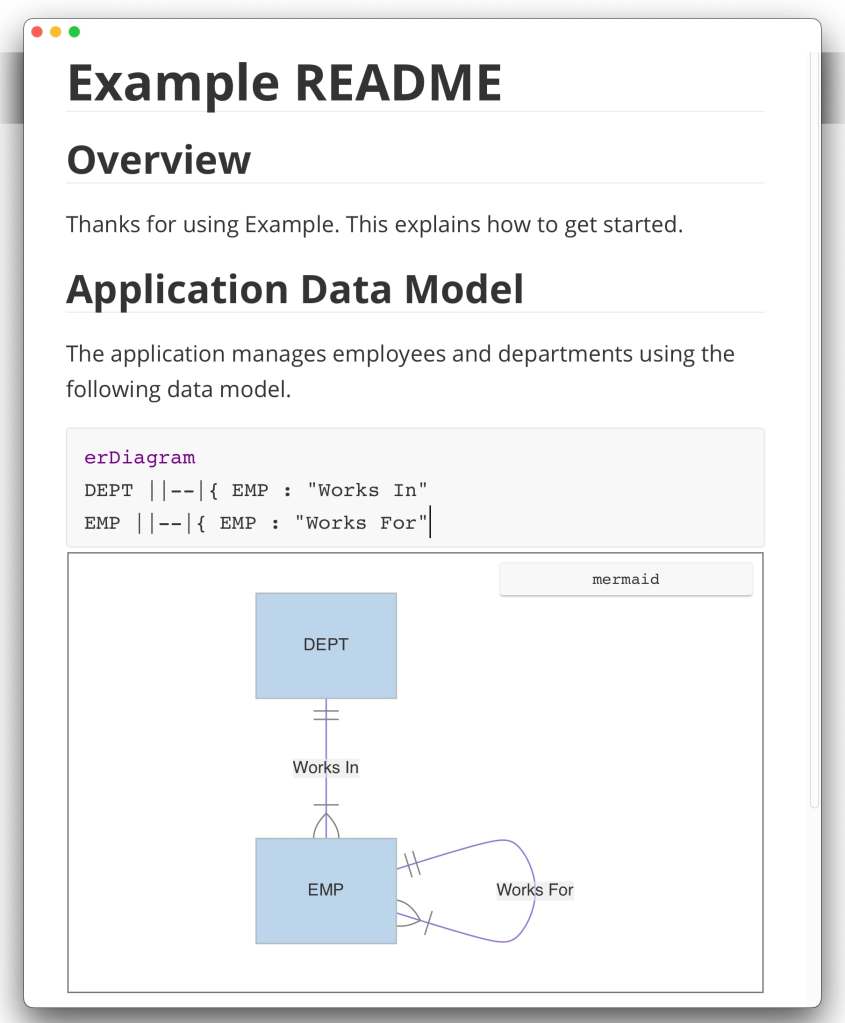
The Mermaid JS open source project aims to improve software documentation quality with an easy-to-maintain diagram syntax for Markdown files. The typical README.md file of a software project can include an Entity/Relationship diagram by simply including text like this:
erDiagramDEPT ||--|{ EMP : "Works In"EMP ||--|{ EMP : "Works For"
Including a diagram like this into your product doc is as simple as shown below:

If your markdown editor offers a WYSIWYG experience, the effect is even more dramatic and productive: you immediately see the results of the diagram you’re editing. For example, editing a Mermaid diagram in a readme file using Typora looks like this:
Popular source control repository sites like GitHub and GitLab have also embraced Mermaid diagrams. Since Markdown is used to provide check-in comments, on these sites (and others like them) it’s easy to include Mermaid diagrams in the helpful summaries you provide along with every commit.
Mermaid’s Diagram Types and Live Editor
Mermaid supports creating many different kinds of diagrams, each using a simple text-based syntax like the ER diagram above. At the time of writing, supported diagram types include Entity/Relationship, Class, Gantt, Flow, State, Mindmap, User Journey, Sequence, Git branch diagrams, and pie charts. The handy Mermaid Live site provides a “sandbox” editor experience where you can experiment with all the different kinds of diagrams, explore samples, and instantly see the results.

For example, after consulting their excellent documentation, I immediately tried including column details into my ER diagram for the DEPT table as shown below:

Rendering Mermaid Diagrams in Web Pages
To maximize the usefulness of the diagrams, the Mermaid project provides a simple JavaScript API to incorporate scalable vector graphics (SVG) renderings of text-based diagrams into any web page or web application. After referencing the Mermaid JS library URL, including a diagram into a page in my APEX application took a truly tiny amount of JavaScript: one line to initialize the library and one line to render the diagram from the text syntax.
In order to reference the current version of the Mermaid JS library on my page, I typed this URL into my page-level JavaScript > File URLs property:
https://cdnjs.cloudflare.com/ajax/libs/mermaid/9.3.0/mermaid.min.js
Then, after including a Static Content region in my page and assigning it a Static Id of diagram, the two lines of JavaScript code I added to the page-level Execute When Page Loads section looked like this:
mermaid.initialize();mermaid.mermaidAPI.render('diagramsvg', `erDiagram DEPT ||--|{ EMP : "Works In" EMP ||--|{ EMP : "Works For"`, (svg) => { document.getElementById('diagram').innerHTML = svg;});
These two lines of “When Page Loads” JavaScript do the following:
- Initialize the Mermaid library
- Render the diagram defined by the text passed in as an SVG drawing
- Set the contents of the
diagramregion to be this<svg id="diagramsvg">element.
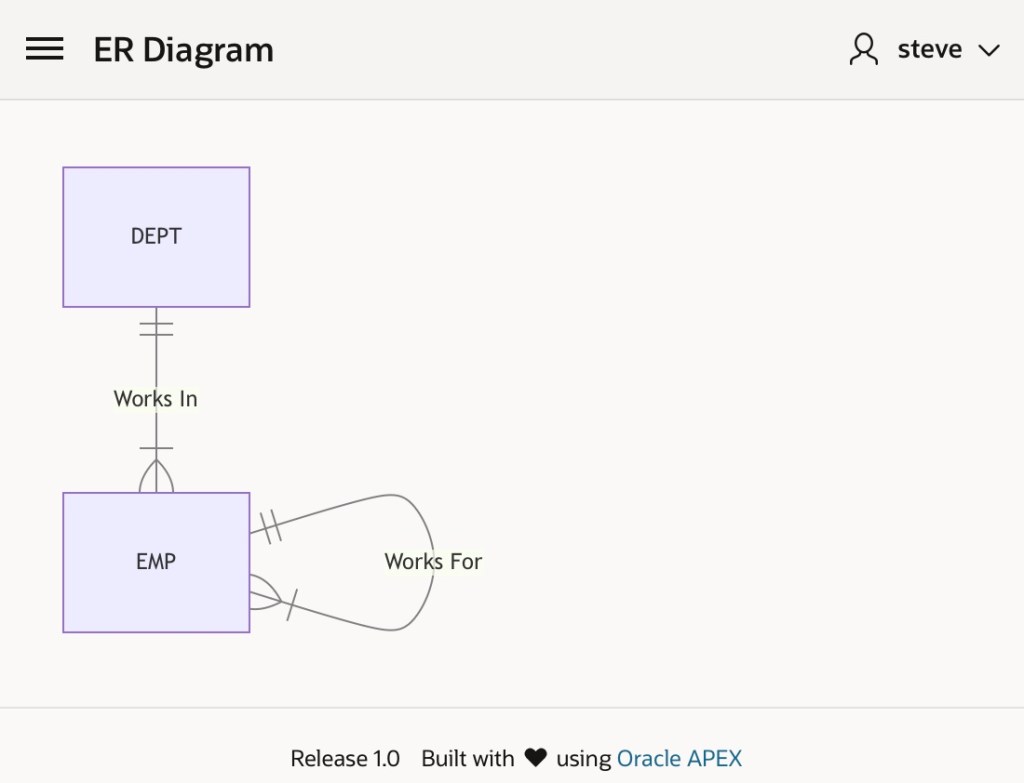
In no time, my APEX page now displayed a text-based Mermaid ER diagram:
Generating Mermaid Diagram Syntax from a Query
After proving out the concept, next I tackled generating the appropriate Mermaid erDiagram syntax based on the tables and relationships in the current APEX application schema. I made quick work of this task in a PL/SQL package function diagram_text() that combined a query over the USER_CONSTRAINTS data dictionary view with another query over the USER_TABLES view.
The USER_CONSTRAINTS query finds the tables involved in foreign key constraints as a “child” table, and gives the name of the primary key constraint of the “parent” table involved in the relationship. By joining a second time to the USER_CONSTRAINTS table, I can query both child and parent table names at once like this:
  select fk.table_name as many_table,
         pk.table_name as one_table
    from user_constraints fk
    left outer join user_constraints pk
                 on pk.constraint_name = fk.r_constraint_name
   where fk.constraint_type = 'R' /* Relationship, a.k.a. Foreign Key */
The USER_TABLES query, using an appropriate MINUS clause, finds me the tables that aren’t already involved in a “parent/child” relationship above. By looping over the results of these two queries and “printing out” the appropriate Mermaid ER diagram syntax into a CLOB, my diagram_text() function returns the data-driven diagram syntax for all tables in the current schema.
I ultimately decided to include some additional parameters to filter the tables based on a prefix (e.g. EBA_DEMO_CONF), to control whether to include column info, and to decide whether common columns like ID, ROW_VERSION, and audit info should be included or not. This means the final PL/SQL API I settled on looked like this:
create or replace package eba_erd_mermaid as function diagram_text(p_table_prefix varchar2 := null, p_include_columns boolean := false, p_all_columns boolean := false ) return clob;end;
Wiring Up the Data-Driven Diagram
With the diagram_text() function in place, I added a hidden CLOB-valued page item P1_DIAGRAM to my page, added a P1_TABLE_PREFIX page item for an optional table prefix, and added two switch page items to let the user opt in to including column information.
Next, I added the computation to compute the value of the hidden P1_DIAGRAM page item using the diagram_text() function:
eba_erd_mermaid.diagram_text( p_table_prefix => :P1_TABLE_PREFIX, p_include_columns => :P1_INCLUDE_COLUMNS = 'Y', p_all_columns => :P1_ALL_COLUMNS = 'Y')
Lastly, I adjusted the “When Page Loads” JavaScript code to use the value of the P1_DIAGRAM hidden page item instead of my hard-coded EMP/DEPT diagram syntax:
mermaid.initialize();mermaid.mermaidAPI.render('diagramsvg', apex.items.P1_DIAGRAM.value, (svg) => { document.getElementById('diagram').innerHTML = svg;});
With these changes, I saw the instant database diagram I’d been dreaming of.
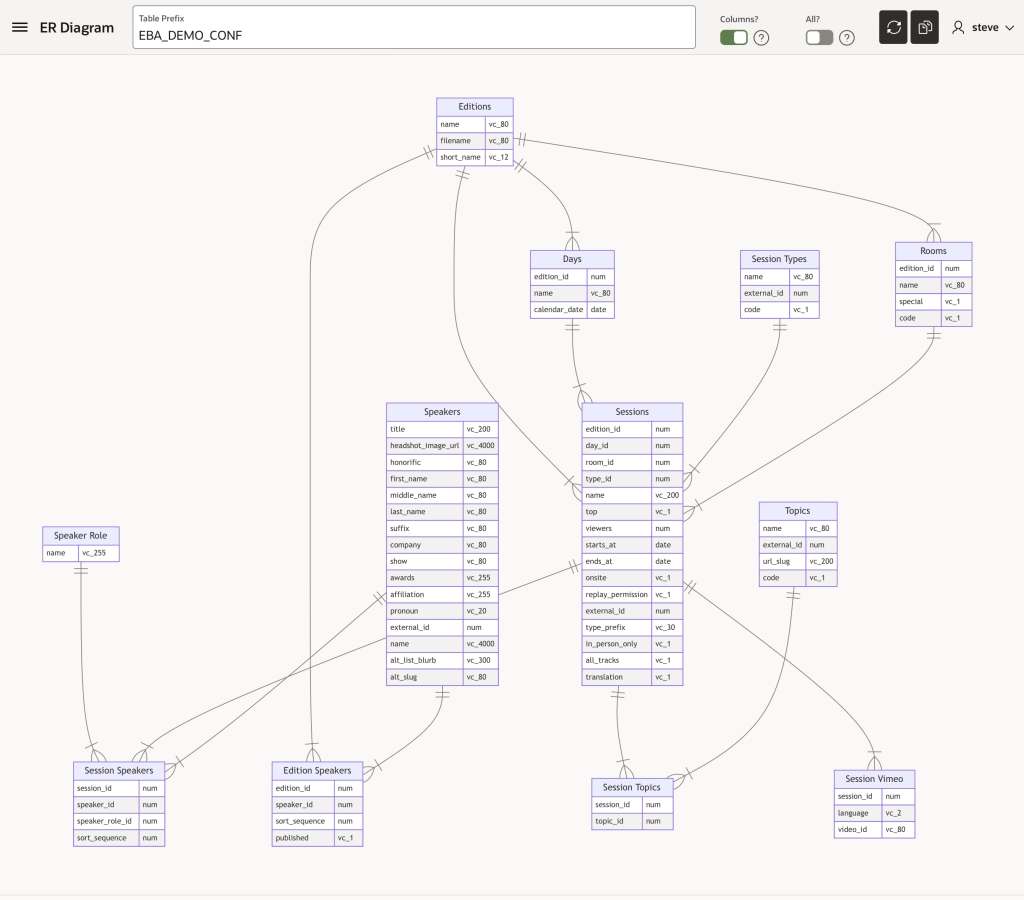
The Mermaid library handles the layout for a great-looking result out of the box. The diagram helped remind me of all the tables and relationships in the APEX app I wrote to manage VIEW Conference, Italy’s largest annual animation and computer graphics conference. It’s one of my volunteer nerd activities that I do in my spare time for fun.

However, when I tried installing my ER Diagram app in another workspace where I’m building a new app with a much larger data model, I realized that the default behavior of scaling the diagram to fit in the available space was not ideal for larger schemas. So I set out to find a way to let the user pan and zoom the SVG diagram.
SVG Pan Zoom
Luckily, I found a second open source project svg-pan-zoom that was just what the doctor ordered. By adding one additional JavaScript URL and one line of “When Page Loads” code, I quickly had my dynamically rendered ER diagram zooming and panning. The additional library URL I included was:
https://bumbu.github.io/svg-pan-zoom/dist/svg-pan-zoom.min.js
The extra line of JavaScript code I added to initialize the pan/zoom functionality looked like this:
var panZoom = svgPanZoom('#diagramsvg');
The combination of Mermaid JS and this SVG pan/zoom library puts some pretty impressive functionality into the hands of APEX developers for creating useful, data-driven visualizations. Even for developers like myself who are not JavaScript experts, the couple of lines required to jumpstart the libraries’ features is easily within reach.
With this change in place, now visualizing larger diagrams including showing column information was possible.
Dream #2: Reverse Engineer Quick SQL
Since I sometimes create APEX apps based on existing tables, a second schema-related dream I had was to reverse-engineer Quick SQL from the current user’s tables and relationships. This would let me quickly add additional columns using a developer-friendly, shorthand syntax as new application requirements demanded them. Googling around for leads, I found a 2017 blog article by Dimitri Gielis that gave me a headstart for the code required. Building on his original code, I expanded its datatype support and integrated it with my table prefix filtering to add a second page to my application that produces the Quick SQL syntax for the tables in the current schema.
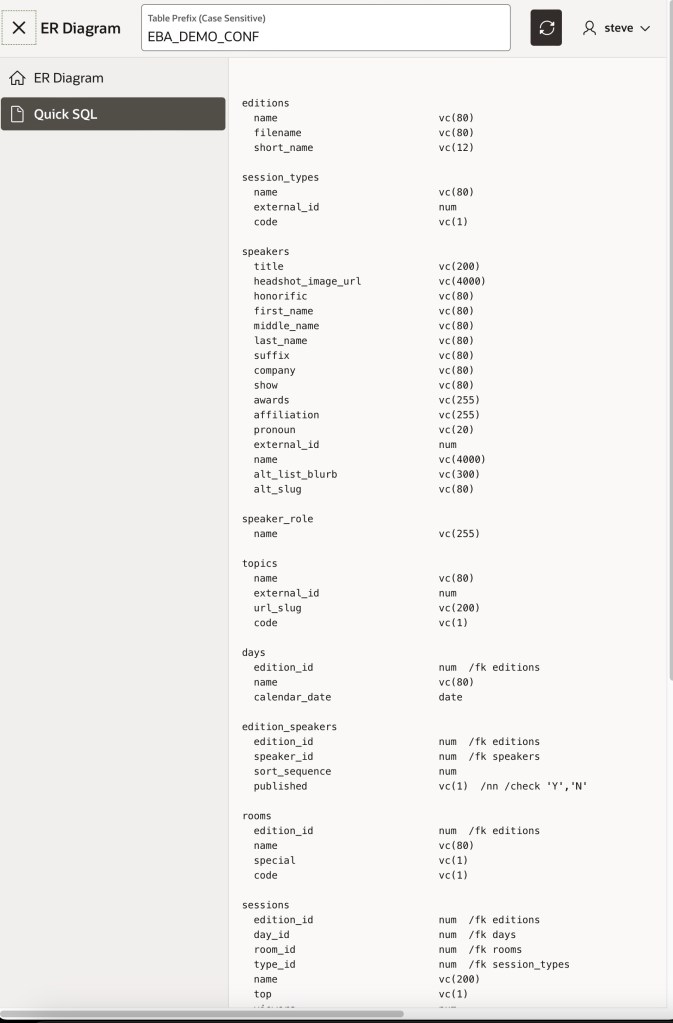
I expanded the eba_erd_mermaid package to include an additional quicksql_text() function for this purpose:
create or replace package eba_erd_mermaid as function diagram_text(p_table_prefix varchar2 := null, p_include_columns boolean := false, p_all_columns boolean := false ) return clob; function quicksql_text(p_table_prefix varchar2 := null) return clob;end;
Copying Text to the Clipboard
As a last flourish, I wanted to make it easy to copy the Mermaid diagram text syntax to the clipboard so I could easily paste it into the Mermaid Live editor if necessary. And while I was at it, why not make it easy to also copy the Quick SQL text syntax to the clipboard to paste into APEX’s Quick SQL utility?
After searching for a built-in dynamic action to copy the text of a page item to the clipboard, I ended up looking for an existing plug-in to accomplish that functionality. I found an aptly-named APEX Copy Text to Clipboard dynamic action plugin from my colleague Ronny Weiss to get the job done easily with a few clicks of declarative configuration.
APEX, SQL & Open-Source JavaScript for the Win!
In short order, by using APEX to combine the power of the SQL that I know and some minimal JavaScript (that I don’t!), I was able to build myself two dream productivity tools to improve my life as an APEX developer in the future.
If you want to give the sample application a spin, download the APEX 22.2 application export from here. It installs only a single supporting PL/SQL package, so any tables you visualize with it will be your own.
Further Reading
For a full-featured, web-based ERD modeling solution from Oracle, make sure to check out the Data Modeler in SQL Developer Web.
Postscript (December 2024, Update)
My colleague Stefan Dobre helped me recently to repackage the Mermaid JS integration as an APEX plug-in and I reworked the diagram generation logic into helper code in the same plug-in. This avoids the app from needing to install any supporting objects at all. You can check out this more modular See DB application (APEX 23.2 export) that uses this plug-in if interested.
