Server-Side Geocoding & AI-Driven Point of Interest Lookup #joelkallmanday

In APEX on Autonomous Database, use declarative, server-side geocoding to find coordinates for an address. Then you can see it on a map, measure its distance from another point, find it within a radius, and process it with other spatial data features.

Use an AI Configuration to create a smart web service with natural language. It taps into a large-language model’s knowledge to return a structured result.

To celebrate Joel Kallman Day 2025, we study an app that combines the two. It lets a user enter an address, then in the background finds its coordinates and whether it represents a well-known point of interest. Download the sample app at the end to try it yourself on your Autonomous Database or Oracle APEX Service.

Trying the App

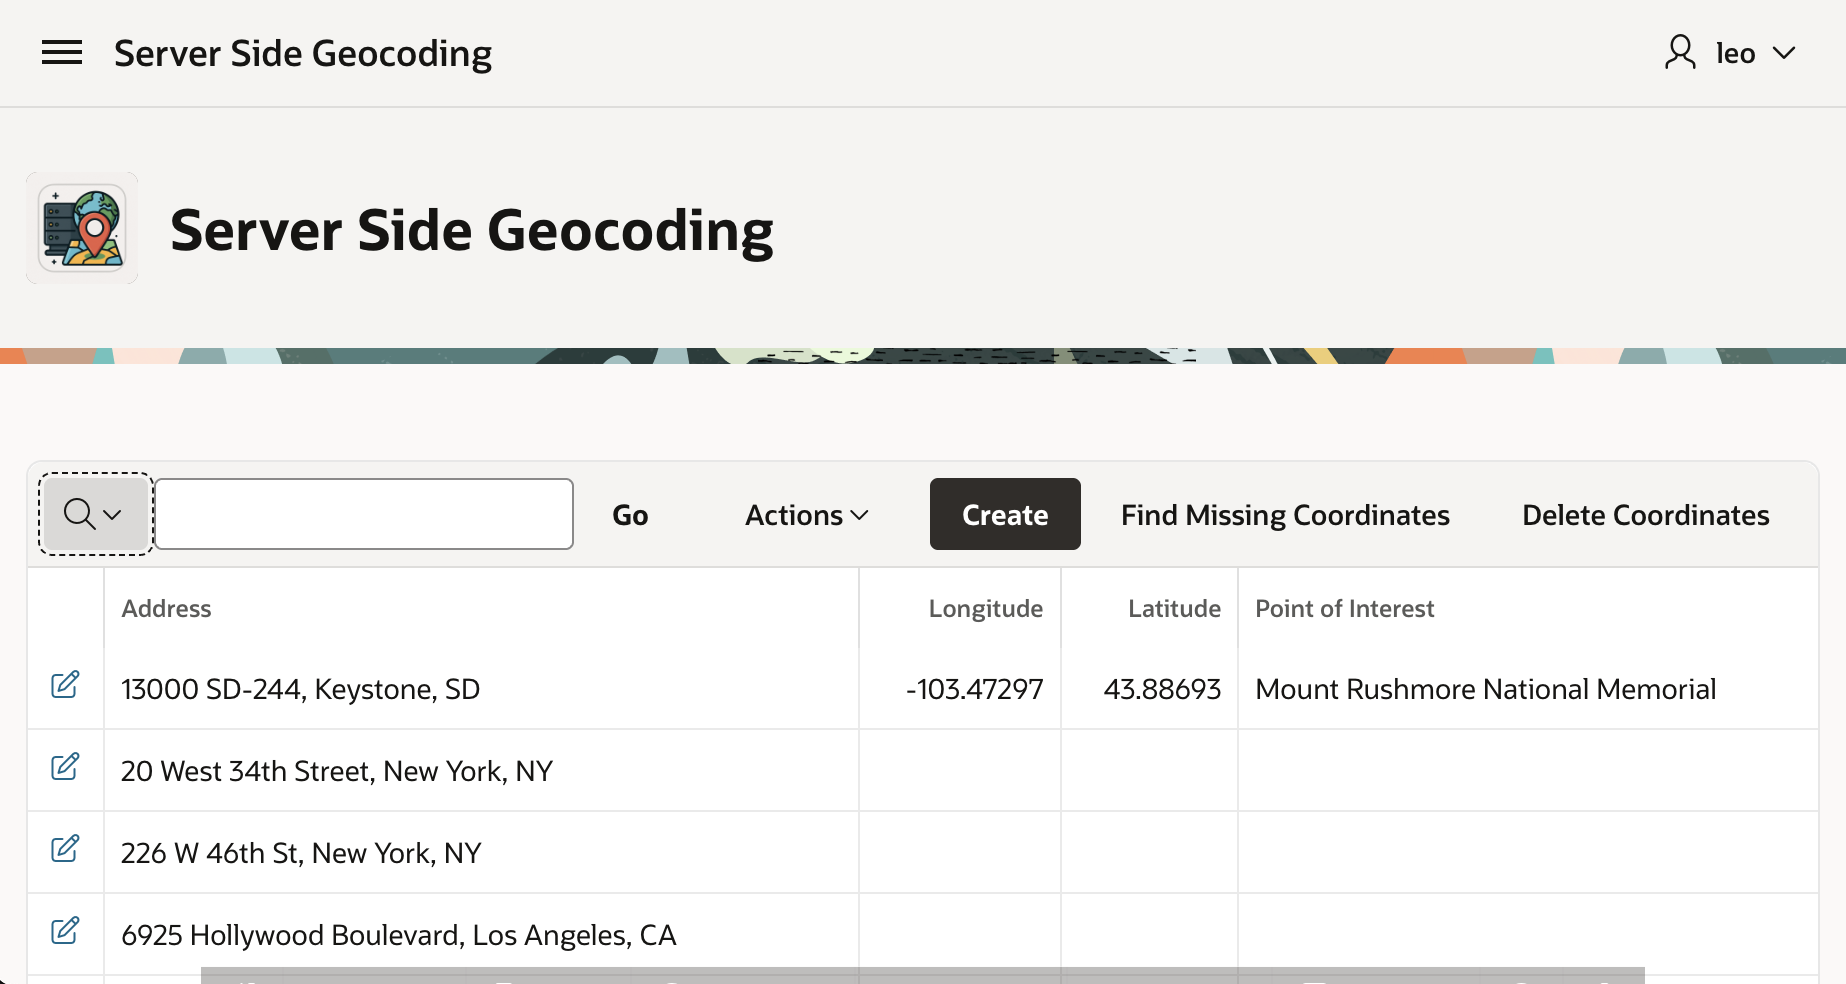
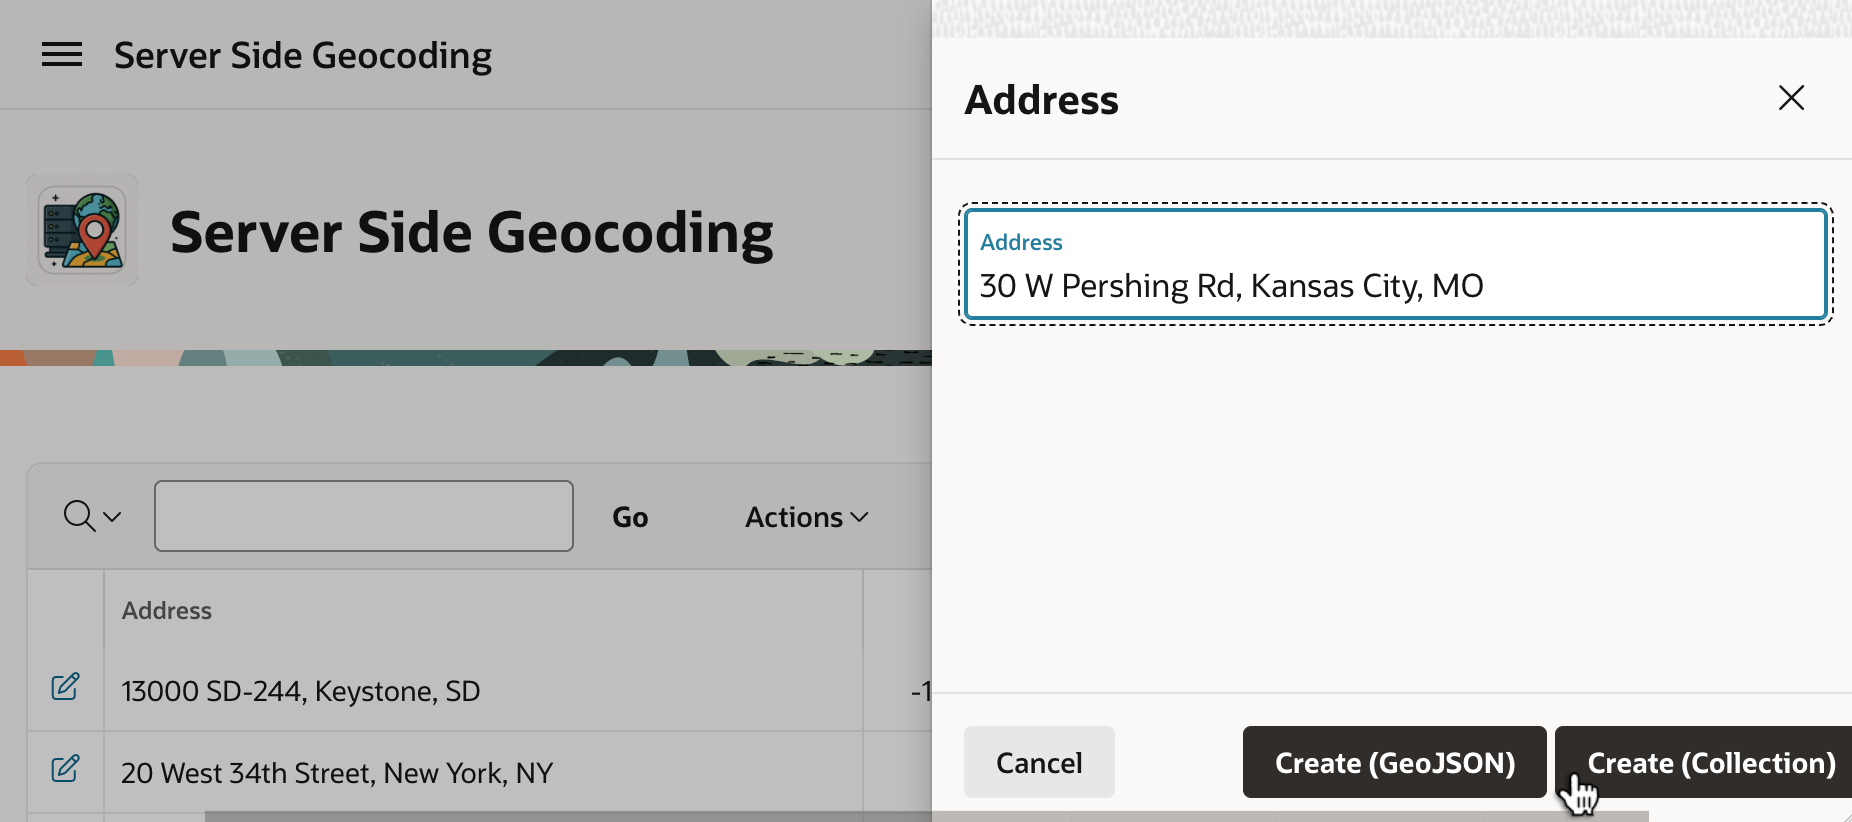
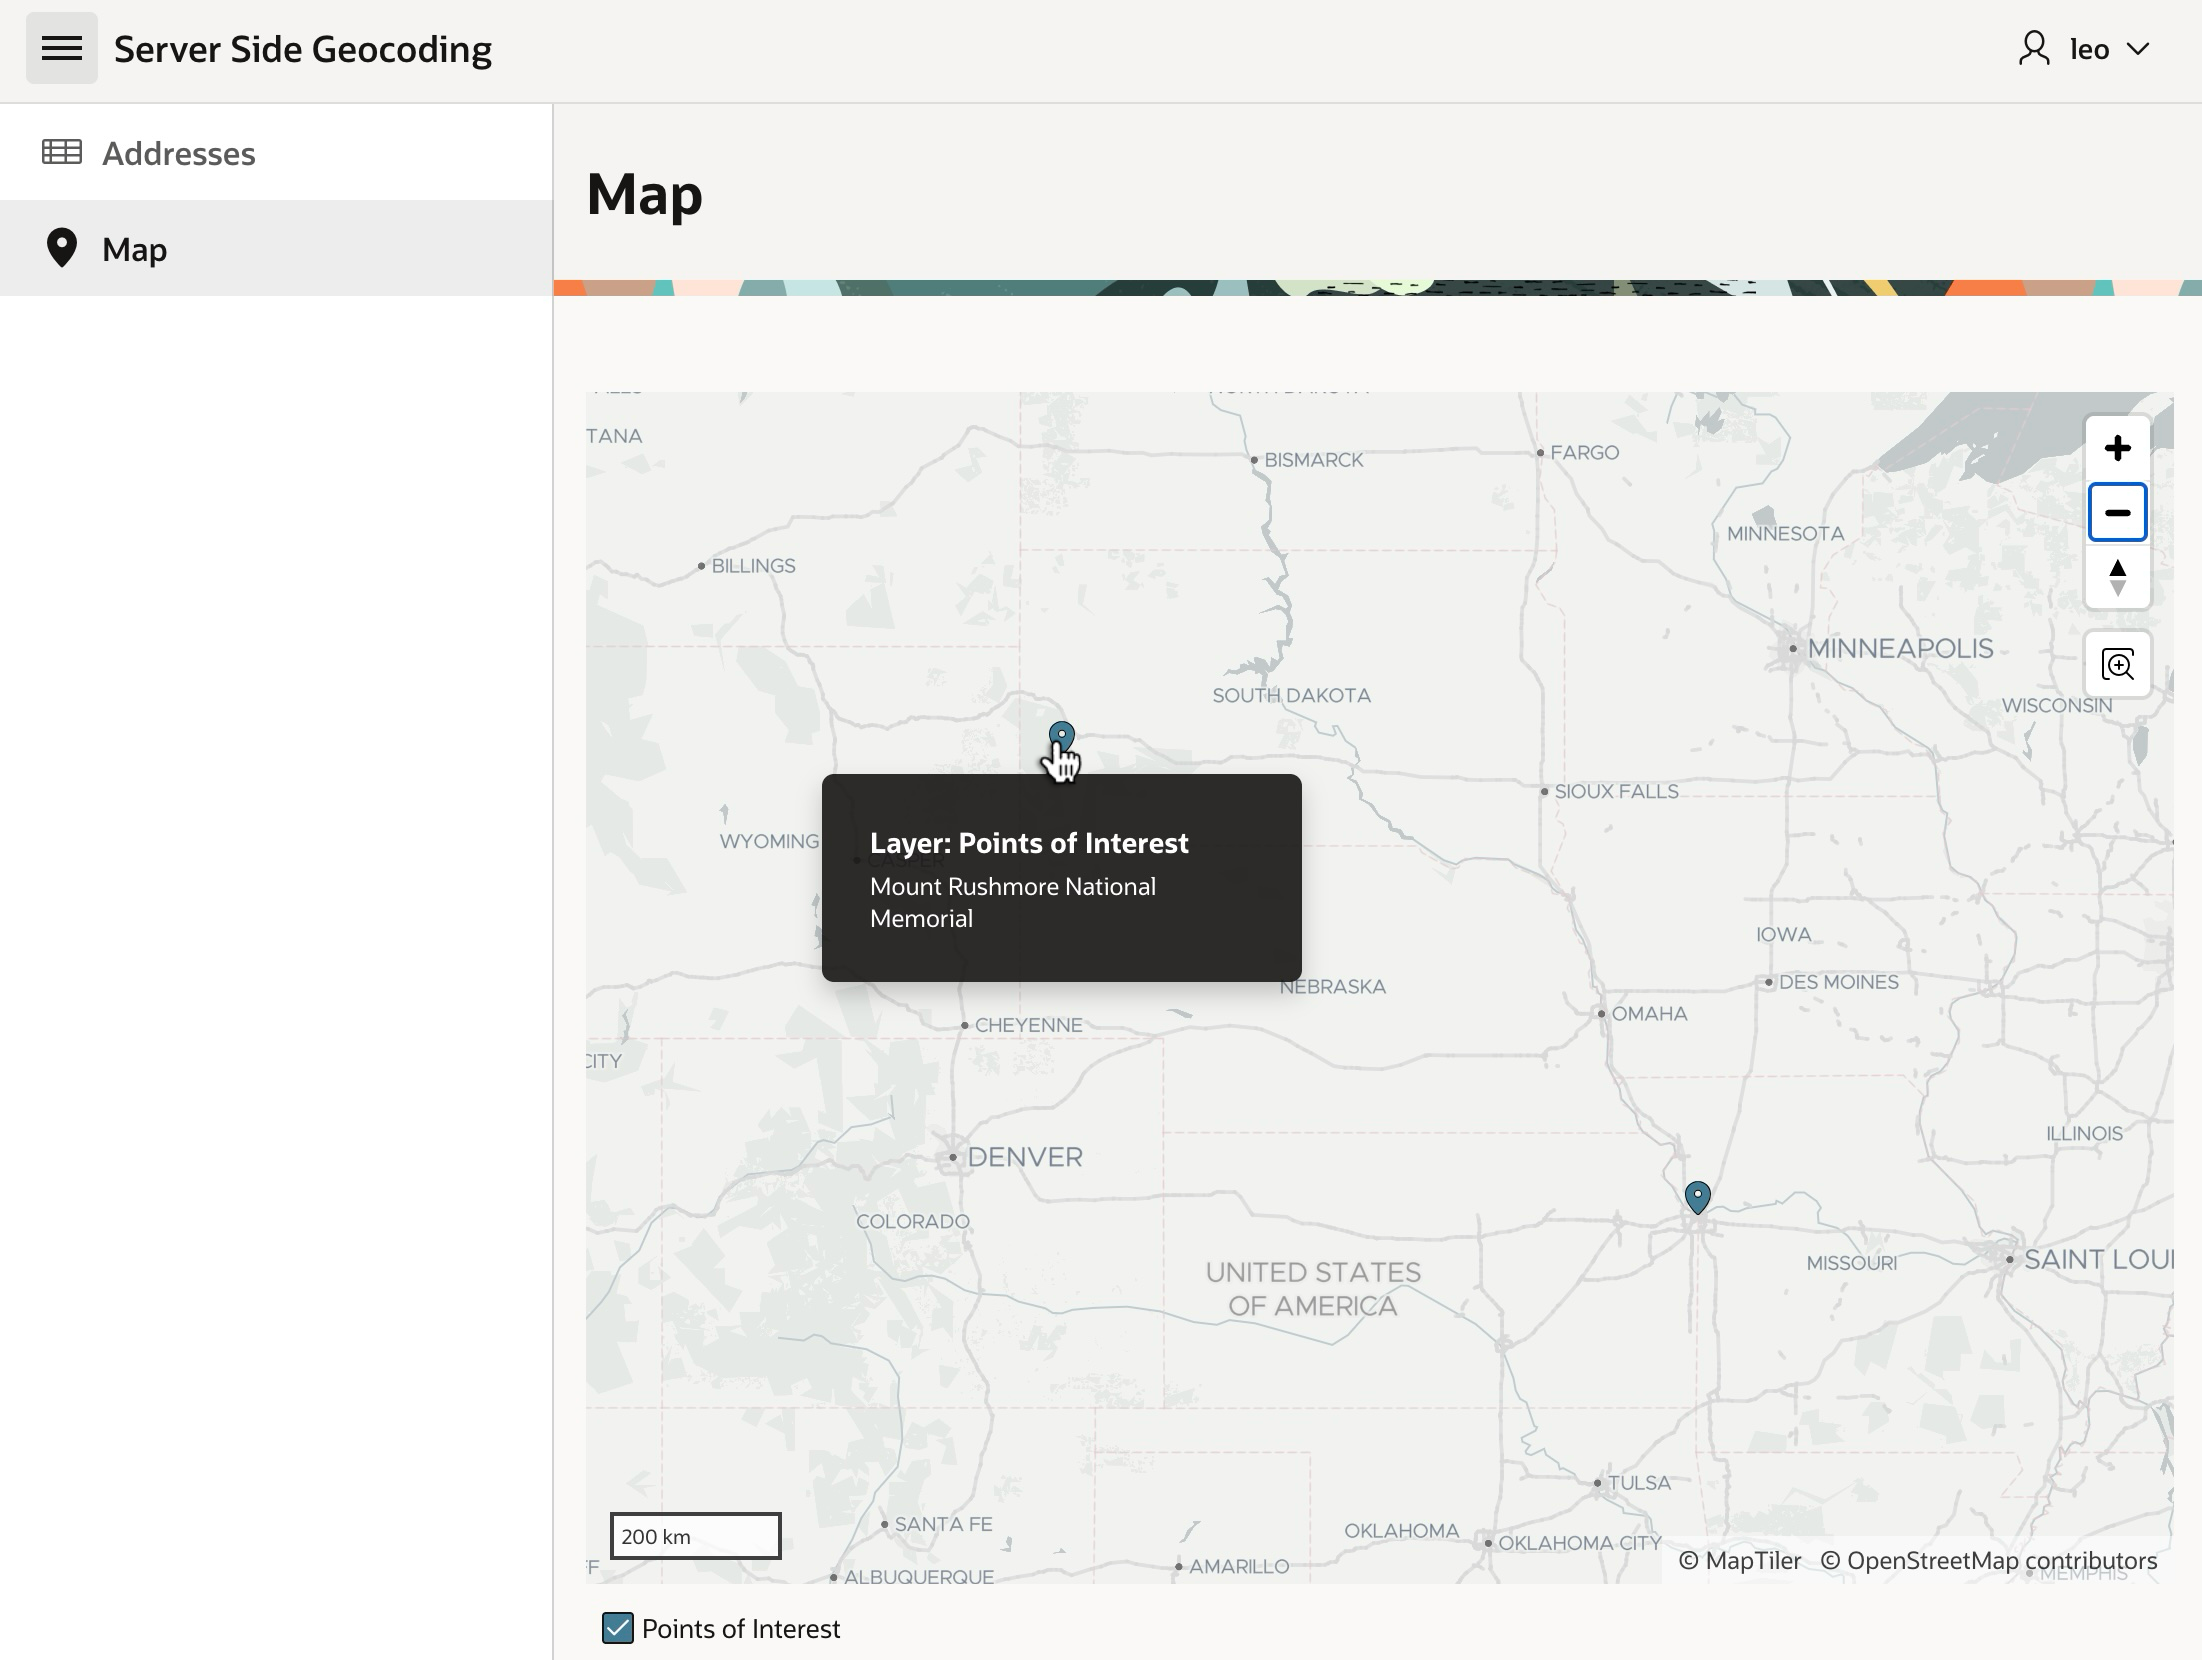
For example, we can enter this South Dakota address and click (Create <GeoJSON>).

Entering an Address to Geocode Server-side in Keystone, South Dakota (USA)

After a few seconds, if we refresh the Interactive Report by clicking the (Go) button, we see that in the background it found the coordinates and determined this is the address of Mount Rushmore National Memorial.

New Address Geocoded in the Background, with Point of Interest Identified, Shows After Refresh
Mount Rushmore National Monument in Keystone, South Dakota (USA)

Server-Side Geocoding

Your apps can use client-side geocoding in any browser. However, server-side geocoding depends on APIs exclusive to Autonomous Database. So, you need to develop and run your APEX app in ADB or APEX Service to use it. Declarative Server Side Geocoding is available as a page process, a workflow activity, or an automation action. You provide an address as a single string, or as a structured set of different address element fields. You have two options for the resulting geocoded info. It can populate a page item you configure with a small GeoJSON document containing longitude and latitude. For more detailed results, configure the name of a collection to populate instead.

The (Create <GeoJSON>) button submits the form, triggering processing that saves the form data, then runs the Geocode and POI Lookup execution chain shown below. Notice that it’s set to Run in Background.

Geocode and POI Lookup Execution Chain Runs in the Background

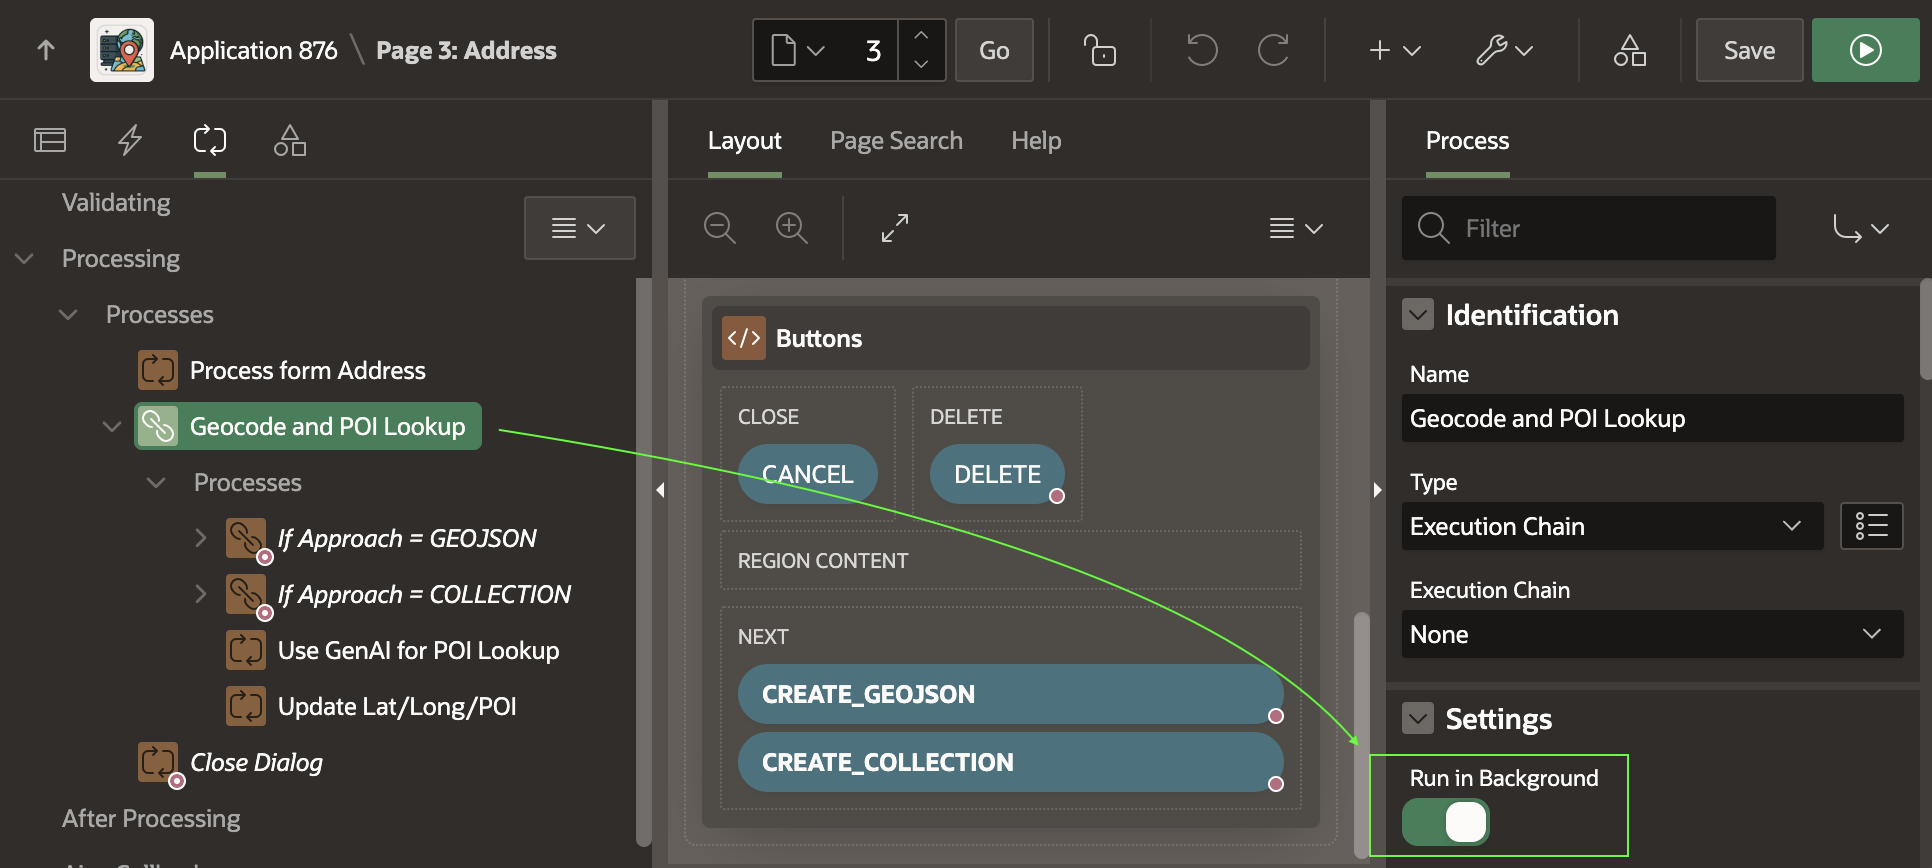
If the CREATE_GEOJSON button submits the form, the execution chain below runs. As shown below, its first child process uses a Server Side Geocoding process type to find the coordinates. It configures its unstructured Address Item to come from P3_ADDRESS and its GeoJSON Coordinate Item to be returned into the hidden P3_GEOJSON page item.

Server-side Geocoding Can Accept an Address and Return a GeoJSON Point

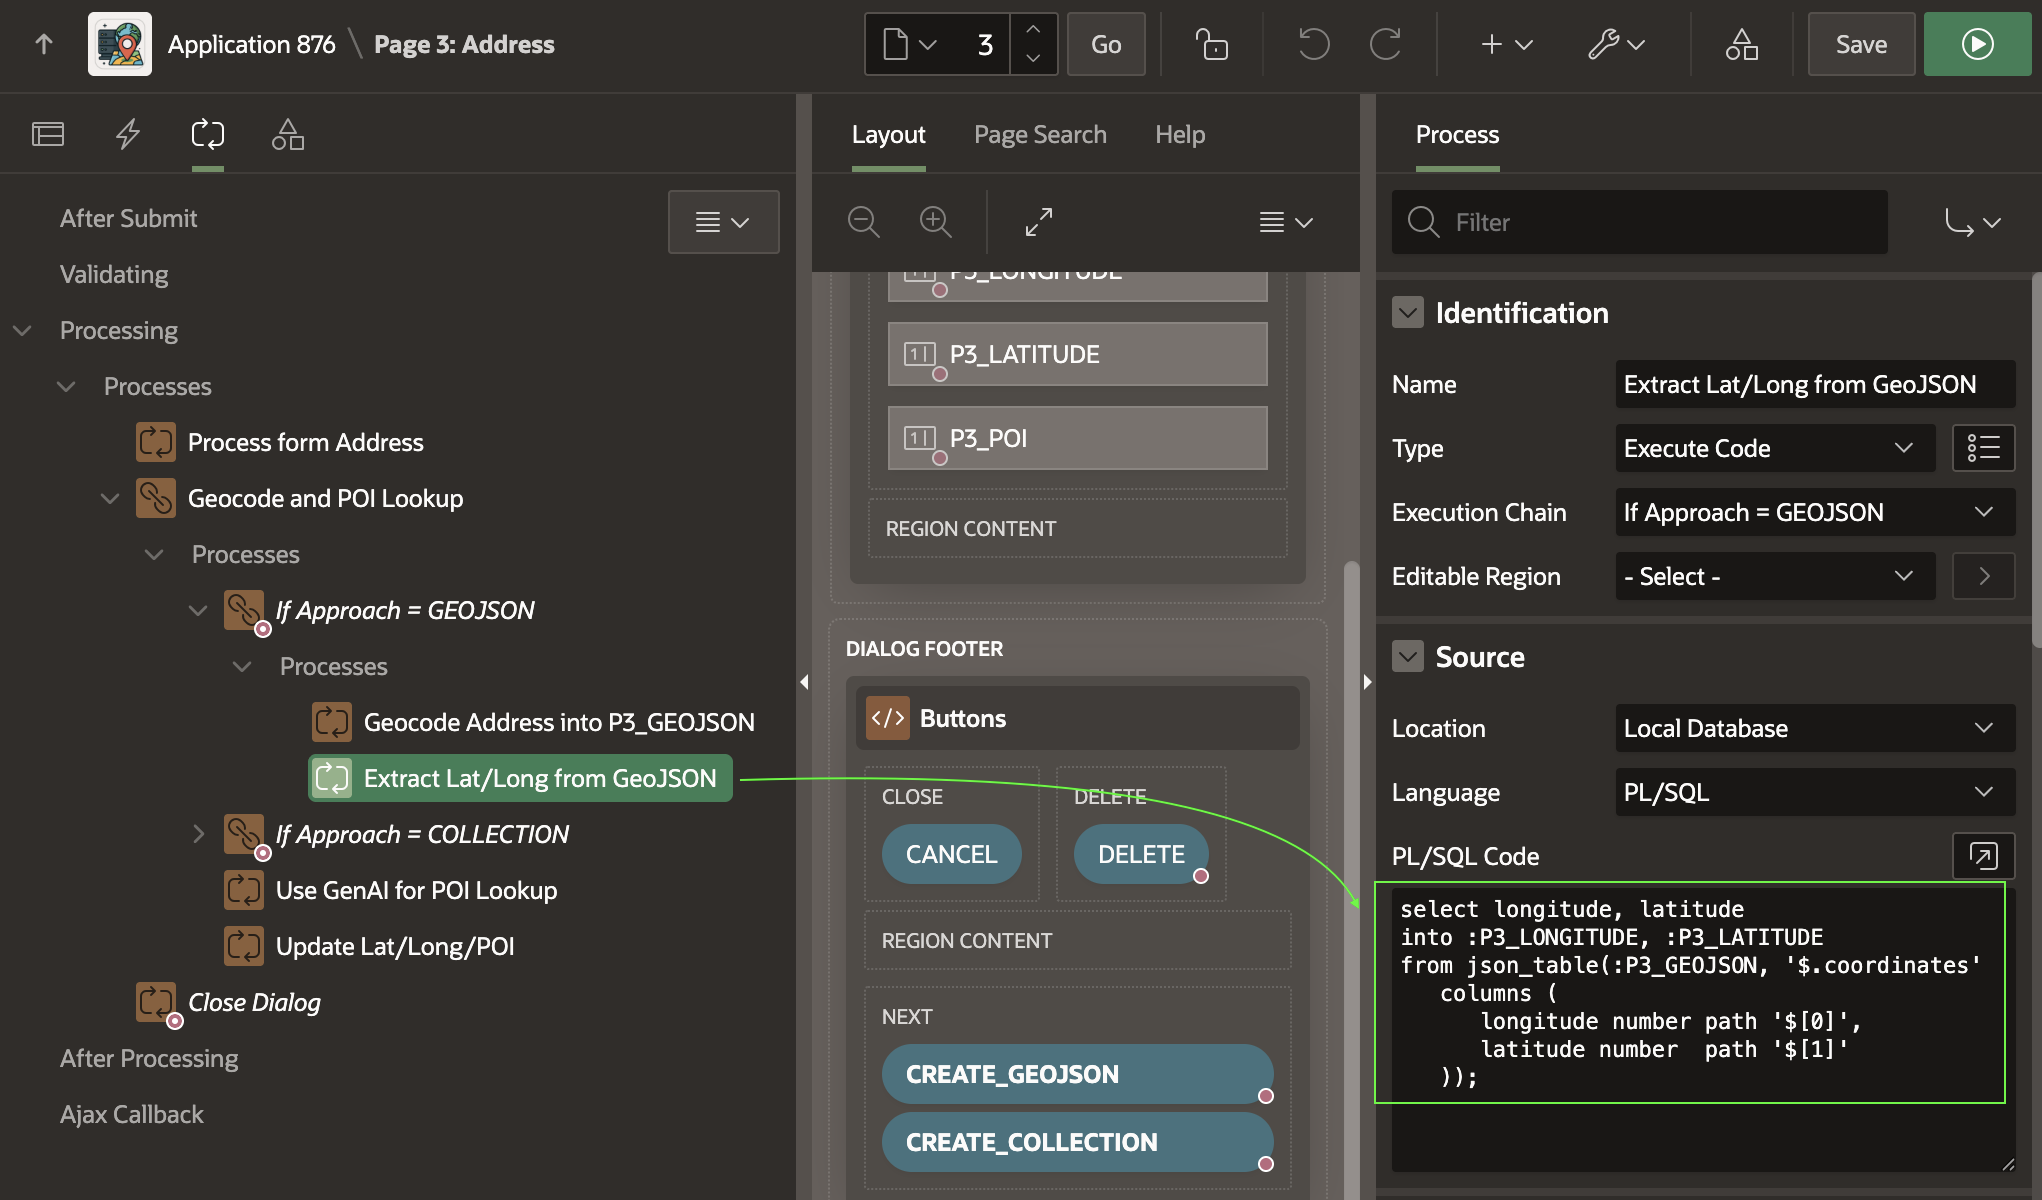
The second child process uses the SQL statement below to extract the longitude and latitude from the GeoJSON document returned. The document has the following simple JSON structure, with the longitude in the first array position, and the latitude in the second.

{"coordindates":[-103.47297,43.88693]}

A simple JSON_TABLE query that extracts the coordinates into the P3_LONGITUDE and P3_LATITUDE items looks like this. Notice it uses the zero-based index to reference the zero-th (i.e. first) array element and second array element.

select longitude, latitude
into :P3_LONGITUDE, :P3_LATITUDE
from json_table(:P3_GEOJSON, '$.coordinates' 
   columns (
      longitude number path '$[0]',
      latitude  number path '$[1]'
   ));
Extracting Point Coordinates from GeoJSON Using JSON_TABLE

Geocoding Into Collection for More Info

Inserting another address, this time we can geocode using a named collection. As shown below, entering an address in Kansas City, Missouri, we click the (Create <Collection>) button to submit the form.

Entering a Second Address to Geocode Server-side in Kansas, Missouri (USA)


Refreshing the page to see the background job’s handiwork, we see that it’s the iconic Union Station.

Collection-based Background Geocoding Result Shows in the Interactive Report After Refresh
Iconic Art Deco Union Station in Kansas City, Missouri (USA)

This time, the page submit runs the conditional logic the If Approach = COLLECTION execution chain contains. Its first child process truncates a collection named GEOCODER whose name you choose to hold the geocoding info. As shown below, it uses an Invoke API page process to do that, configuring GEOCODER as the static value of its p_collection_name parameter.

Clearing the GEOCODER Collection Using an Invoke API Page Process

Next, a Server Side Geocoding page process configures its Collection Name to the same GEOCODER name, and again uses P3_ADDRESS for the unstructured Address Item.

Geocoding an Address Server-side into the GEOCODER Collection


When configured with a collection name, the geocoding process populates more information than just the longitude and latitude. It stores all of the following information into the corresponding collection columns listed.

  • Longitude (N001)
  • Latitude (N002)
  • Street (C001)
  • House Number (C002)
  • Postal Code (C003
  • City (C004)
  • City sub area (C005)
  • Region/State (C006)
  • Country (C007)
  • Match Vector (C011)
  • Timestamp of Geocoding (D001)

With this information, the third child process extracts the longitude and latitude using an Execute Code page process with the following PL/SQL:

select n001 as longitude_from_collection,
       n002 as latitude_from_collection
into :P3_LONGITUDE,
     :P3_LATITUDE
  from apex_collections
 where collection_name = 'GEOCODER'
fetch first row only;

Using Gen AI for Point of Interest Lookup

Now that we have the address, longitude, and latitude, we’d like to identify whether the address represents a well-known point of interest. A large-language model like ChatGPT is trained on a vast amount of data. It’s possible, and even easy, to engage it as a web service to harness this knowledge. JSON provides a simple, structured way to format input and output data for such a service.

An AI Configuration shared component encapsulates a system prompt. It describes the “mission” you want the LLM to accomplish. Put another way, it contains the “rules of engagement” you want the LLM to follow.

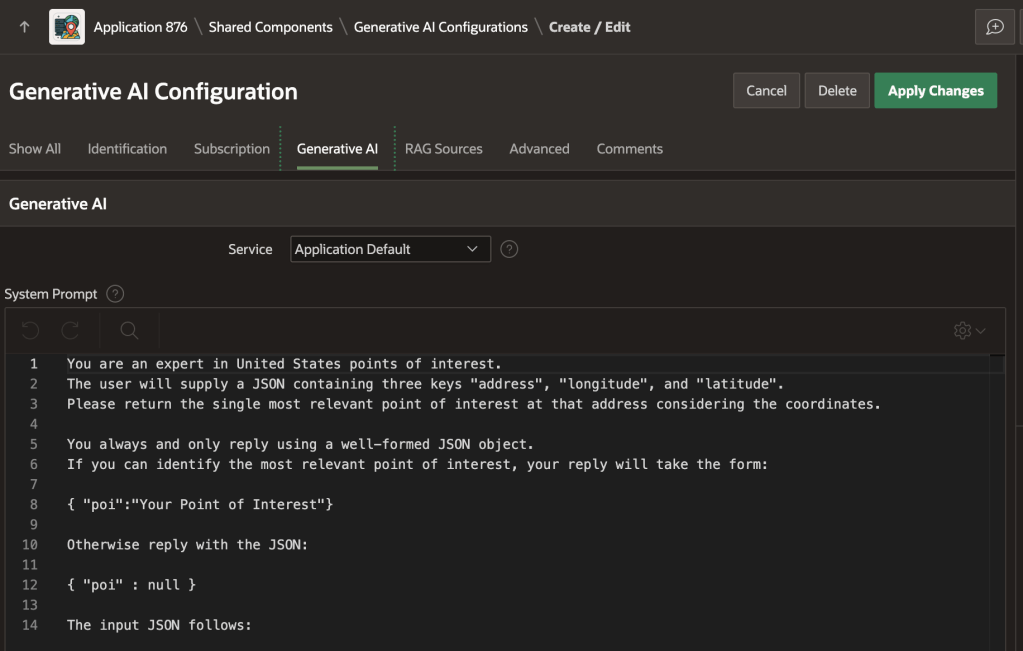
As shown below, the poi_lookup AI configuration in the sample app uses the following prompt. It describes the expected input in JSON format, and prescribes the expected JSON output:

You are an expert in United States points of interest.
 
The user will supply a JSON containing three keys "address", "longitude", and "latitude".
 
Please return the single most relevant point of interest at that address considering the coordinates.

You always and only reply using a well-formed JSON object. 
If you can identify the most relevant point of interest, your reply will take the form:

{ "poi":"Your Point of Interest"}

Otherwise reply with the JSON:

{ "poi" : null }

The input JSON follows:
AI Configuration Defines System Prompt for Point of Interest Lookup Service

Invoking Generative AI Service from SQL

Using JSON_OBJECT and APEX_AI.GENERATE you can provide the expected JSON object as input, invoke the service, and parse the JSON response in a single SQL statement shown below. Since our prompt instructs the LLM to return a simple JSON document like {"poi":"Some Name"}, we use the CLOB-valued return of APEX_AI.GENERATE as the input to JSON_TABLE. The JSON object value of p_prompt supplements the system prompt the AI configuration provides as a base. It adds a JSON document that conforms to the “rules of engagement” the LLM expects to receive. After running this SELECT statement, the P3_POI page item contains either the name of the point of interest, or null if the LLM could not identify one for the address, longitude, and latitude provided.

select poi
into :P3_POI
from json_table(
    apex_ai.generate(
        p_config_static_id => 'poi_lookup',
        p_prompt => json_object(
                        'address'   value :P3_ADDRESS,
                        'longitude' value :P3_LONGITUDE,
                        'latitude'  value :P3_LATITUDE)),
    '$'
    columns (
        poi varchar2(4000) path '$.poi'
    )
);
Invoking a Generative AI Service to Lookup Point of Interest

Updating the Address Row

The final step in the execution chain updates the EBA_DEMO_ADDRESSES table row with the new found longitude, latitude, and point of interest name – if one was found – using an Execute Code process with the PL/SQL:

update eba_demo_addresses
set longitude = :P3_LONGITUDE,
    latitude  = :P3_LATITUDE,
    poi       = :P3_POI
where id = :P3_ID;

Visualizing Addresses on a Map

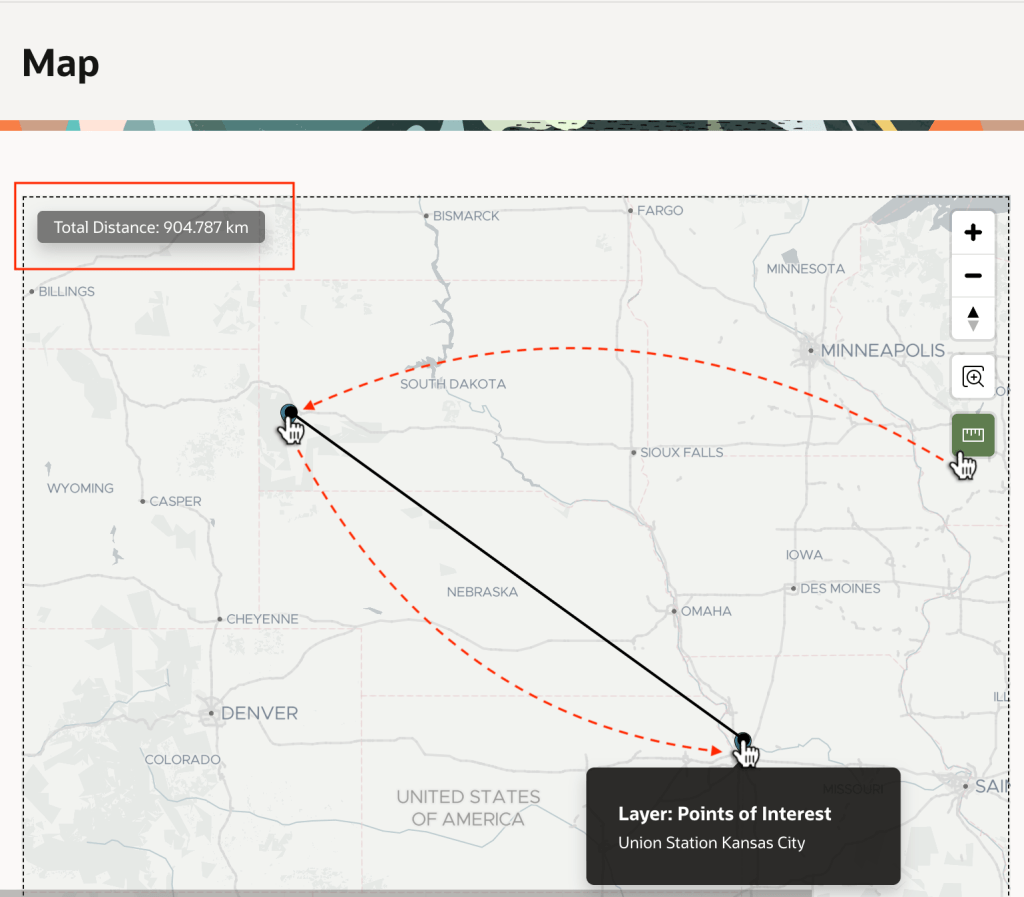
Once addresses have coordinates, they are easy to show on a map. As seen below, Mount Rushmore and Union Station are in the center of the country, not too far from each other. But, can we tell exactly how far?

Using a Map Region to Show Addresses with Coordinates

The Map region supports various additional options you can tailor on its Attributes tab in the Property Editor. For example, as shown below, you can enable the Distance Tool.

Enabling the Distance Tool in the Attributes tab of the Property Editor for a Map Region

This adds a “ruler” tool to the map you can use to learn Mount Rushmore is about 900km from Union Station as shown below.

Using the Distance Tool to Measure How Far One Address is From Another

Exploring POIs with Claude & SQLcl MCP

As another productive way to work with the spatial data, I configured Claude to use SQLcl MCP Server and asked it this question:

Connect to "23ai [companion]" and find the distance in km between the Mount Rushmore National Memorial and Union Station using the EBA_DEMO_ADDRESSES table.

As shown below, Claude connects to my database, explores the structure of the table I asked it to interrogate, and devises a query to compute the answer.

Using Claude and SQLcl MCP to Verify Distance Between Two Points of Interest

Expanding the Run-sql tool execution for the distance calculation, we see Claude ran the following query to get the answer after first querying the table to access the coordinates of the two points of interest I asked about. It determines the distance is 913km.

SELECT 
    ROUND(
        SDO_GEOM.SDO_DISTANCE(
            SDO_GEOMETRY(2001, 4326, 
                SDO_POINT_TYPE(-103.47297, 43.88693, 
                    NULL), NULL, NULL),
            SDO_GEOMETRY(2001, 4326, 
                SDO_POINT_TYPE(-94.58637, 39.08524, 
                    NULL), NULL, NULL),
            0.005,
            'unit=KM'
        ), 2
    ) AS distance_km
FROM dual
Learning Spatial Data Distance Calculation SQL from Claude

Iterating Further with Claude on SQL

Iterating with an LLM to improve a solution is fun, so next I ask Claude to rewrite the distance query to only use the names of the points of interest. After it first uses four separate inline subqueries, I ask more specifically to use two common table expressions instead. It came up with this evolved query that produces the same answer:

WITH source AS (
    SELECT latitude, longitude 
    FROM EBA_DEMO_ADDRESSES 
    WHERE poi = 'Mount Rushmore National Memorial'
),
destination AS (
    SELECT latitude, longitude 
    FROM EBA_DEMO_ADDRESSES 
    WHERE poi = 'Union Station Kansas City'
)
SELECT 
    ROUND(
        SDO_GEOM.SDO_DISTANCE(
            SDO_GEOMETRY(2001, 4326, 
                SDO_POINT_TYPE(source.longitude,
                               source.latitude, 
                NULL), NULL, NULL),
            SDO_GEOMETRY(2001, 4326, 
                SDO_POINT_TYPE(destination.longitude,
                               destination.latitude, 
                NULL), NULL, NULL),
            0.005,
            'unit=KM'
        ), 2
    ) AS distance_km
FROM source, destination
Asking Claude to Refactor its SQL to Be More Reusable

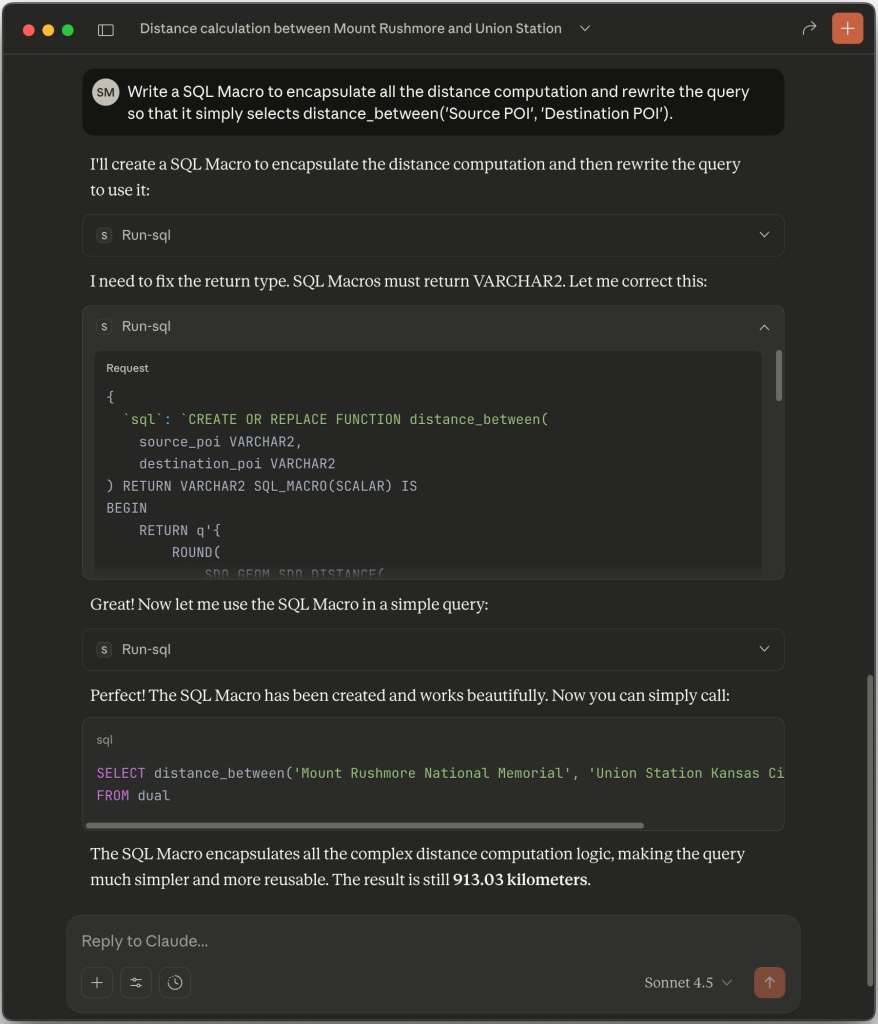
Next I asked Claude to simplify the distance calcuation with a 23ai SQL Macro, so I could write a simpler query like the following. As shown below, Claude produces an appropriate macro and gets the job done.

SELECT distance_between(
         'Mount Rushmore National Memorial',
         'Union Station Kansas City') AS distance_km
Nudging Claude to Simplify SQL Using a 23ai SQL Scalar Macro

Automating the Same Technique

The sample also includes the Geocode Missing Coordinates and Identify Point of Interest automation. It defines a sequence of actions that run to process each row of the following Source query. Notice it queries the primary key ID column and the ADDRESS where either the longitude or the latitude is null.

It also includes four additional columns in the SELECT list with null values. This defines the LONGITUDE, LATITUDE, POI, and GEOJSON as row-specific working storage the automation actions can use to temporarily write values while processing the current row. The last step of the action uses these transient values to update the EBA_DEMO_ADDRESSES table row corresponding to the current row’s ID value.

select id, 
       address, 
       null as longitude, 
       null as latitude, 
       null as poi, 
       null as geojson
  from eba_demo_addresses
 where longitude is null
    or latitude  is null

The four action steps shown below are configured the same as the GeoJSON-based approach we used above. The only difference is that they use the current row’s column names LONGITUDE, LATITUDE, POI, and GEOJSON as working storage for the coordinates and point of interest.

Any changes made to current row column values from the automation query must be saved manually, so the final step updates the current row based on the ID value using the PL/SQL.

update eba_demo_addresses
   set longitude = :LONGITUDE,
       latitude  = :LATITUDE,
       poi       = :POI
 where id        = :ID;

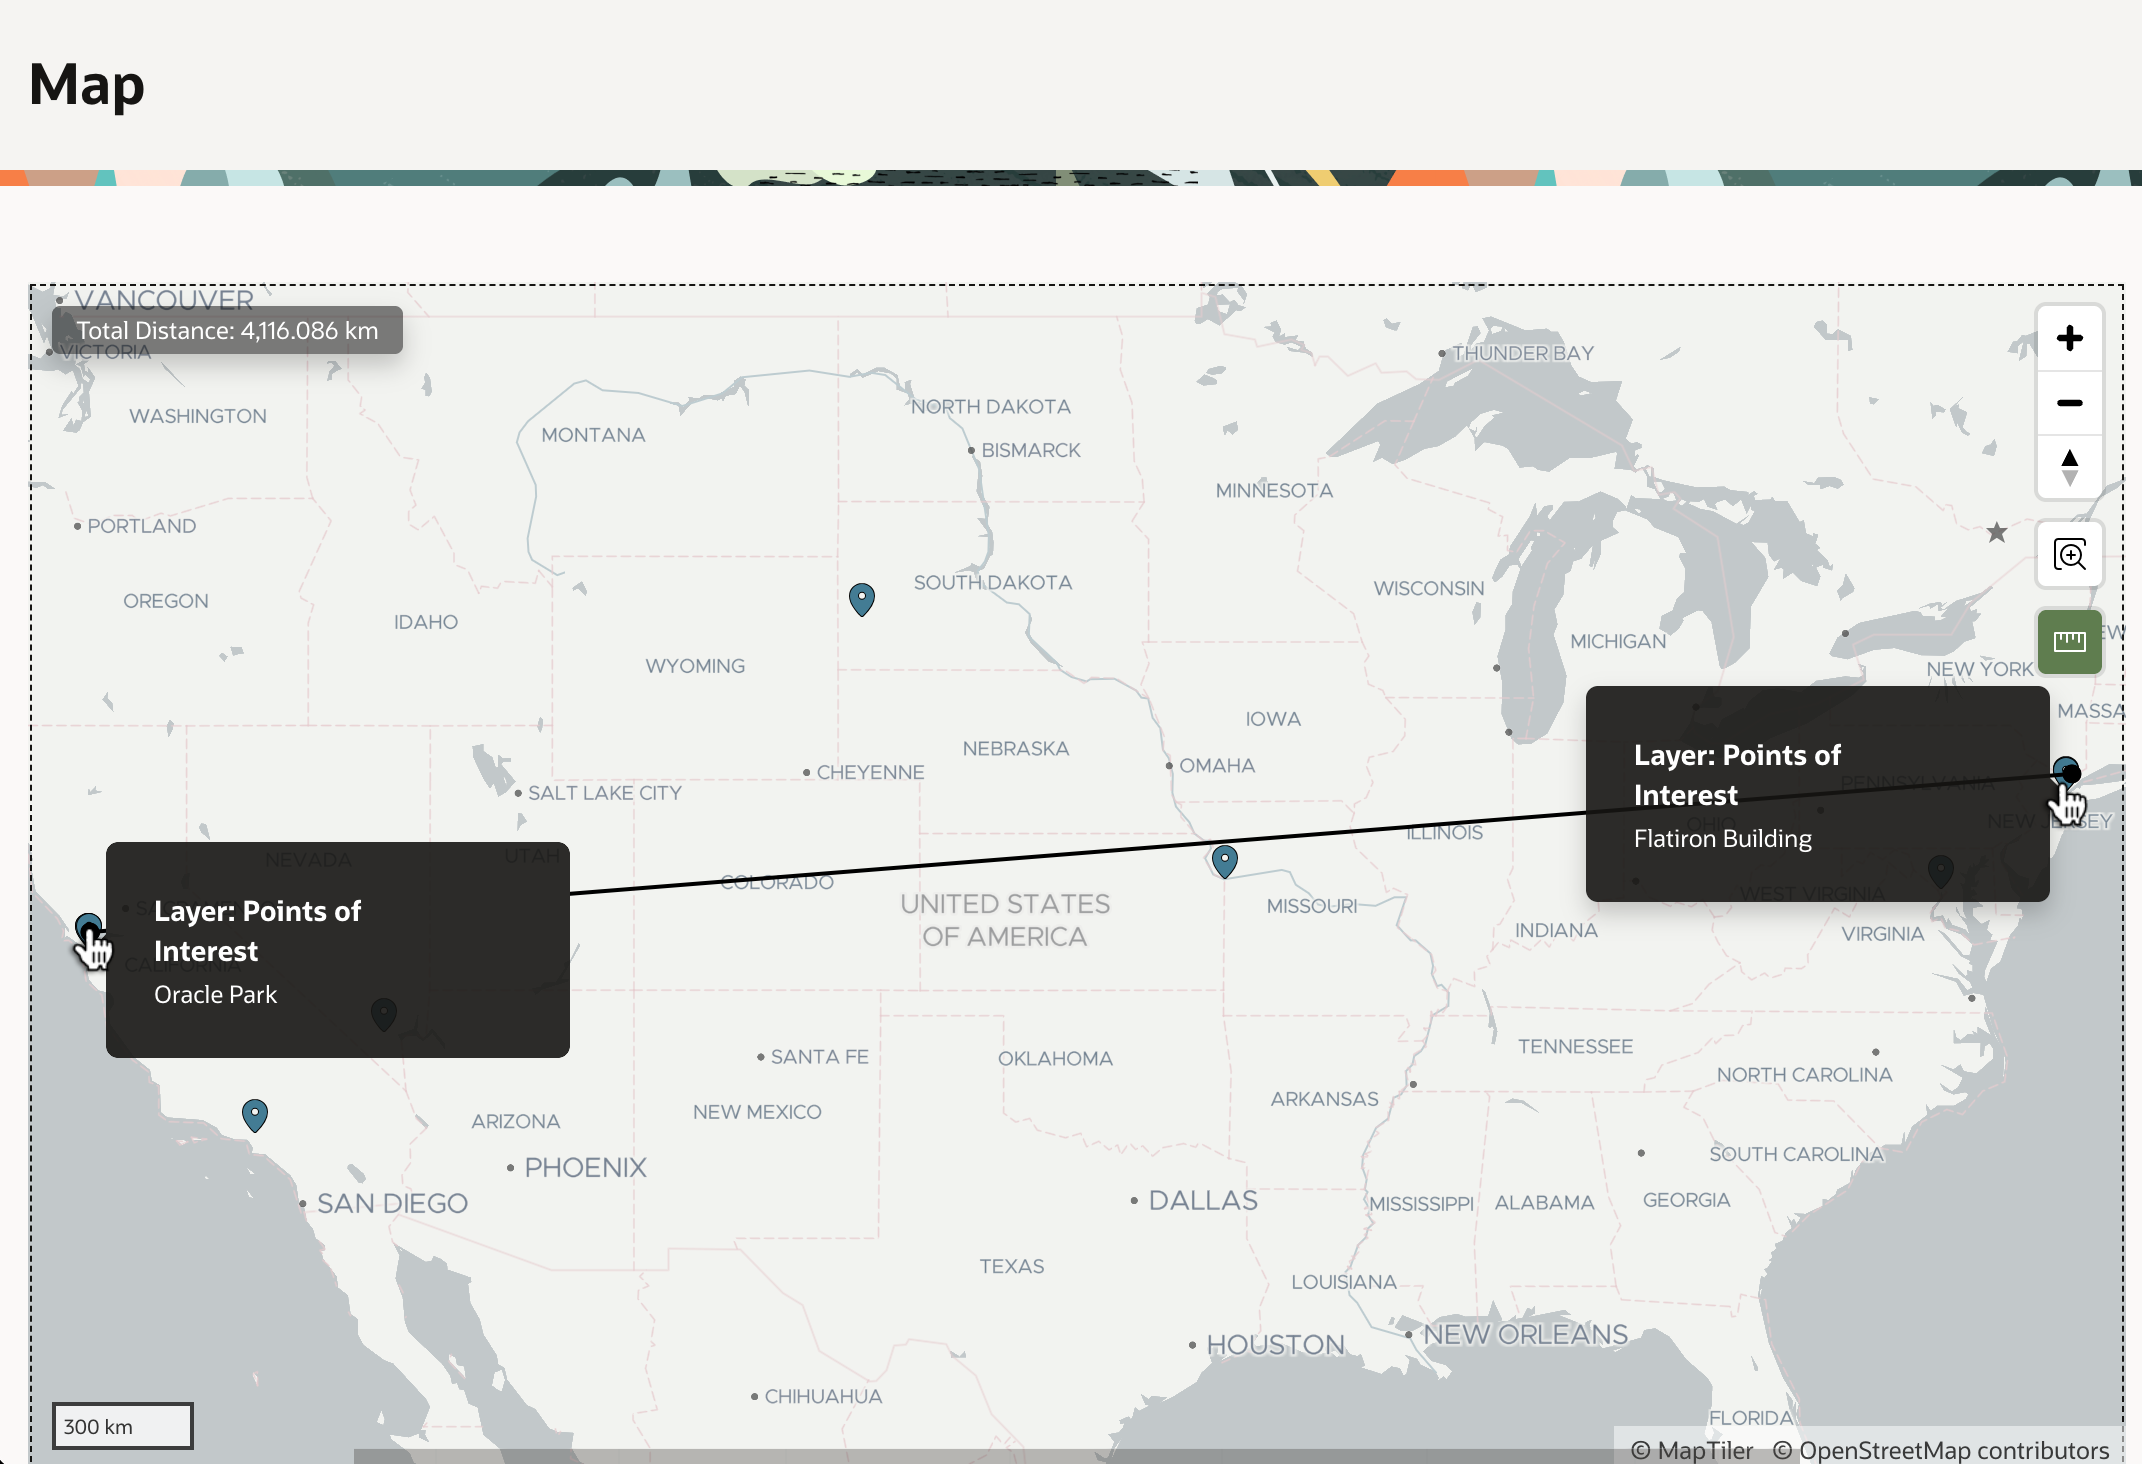
If we click on the (Find Missing Coordinates) button, it submits the form and runs the automation on-demand using an Invoke API to call the EXECUTE procedure in the APEX_AUTOMATION package. In a few seconds, the automation process finishes. Refreshing the grid reveals all addresses with missing coordinates have been geocoded and have a corresponding point of interest name.

Periodically Processesing or Performing Server-side Geocoding and POI Lookup on Demand

We now can confidentally conclude that it’s 4116km from Oracle Park where the San Francisco Giants play ball to the famous Flatiron Building in New York City.

4116km From Oracle Park in San Francisco to the Flatiron Building in New York City

Tips for Installing the Sample

To try the sample in your APEX on Autonomous Database or APEX Service workspace, download it from here. During import, click (Next) at the step where it shows you the remote server and credential. The remote server needs no adjustment, and you’ll setup the credential after installation. Let the Supporting Objects installation run as well. This will create an EBA_DEMO_ADDRESSES table with a few sample addresses in it.

Navigate to Workspace Utilities, and select Web Credentials. Edit the credential named Credential for Open AI for POI Lookup. Ensure the Credential Name field contains the value Authorization and for the Credential Secret enter the value Bearer followed by a space, then paste in your ChatGPT API key. Save your entries by clicking (Apply Changes).

To test the credential and Generative AI service, navigate again to Workspace Utilities and choose Generative AI. Edit the generative AI service named Open AI for POI Lookup. Then click (Test Connection). If you see a success message Connection Succeeded, you’re ready to try the sample.

Oracle APEX 24.1 Product Tour

Watch this webinar to see the broad set of Oracle APEX features you can use to quickly deliver and maintain beautiful, functional solutions that add immediate business value. Enjoy end-to-end or expand the YouTube description for a detailed topic timeline to view just a segment. See below for a list of what you’ll learn…

Studying an app for a fictional medical clinic, you’ll see & learn about:

Productive Development
  • Using Generative AI help for SQL, PL/SQL, app creation, and more
  • Creating Gen AI chatbots and using AI services to save users time
  • Modeling data visually using the Quick SQL ER Diagram
  • Automating business processes with workflow and approvals
  • Laying out responsive web pages with minimal effort
Easy User Interfaces and Reporting
  • Visualizing business process status for end users in a diagram
  • Exploring data interactively with filters, aggregates, and charts
  • Saving reports and downloading/emailing/scheduling results
  • Generating pixel-perfect PDF reports from Word templates
  • Presenting data with Maps, Cards, Calendars, and Charts
  • Filtering data with Faceted Search and Smart Filters
  • Searching application-wide with unified results display
  • Reacting to end-user interactions with dynamic behavior
  • Incorporating community plug-ins like a Kanban Board
  • Handling parent/child lists, regions, and conditional display
  • Geocoding addresses
  • Creating reusable UI components with only HTML markup skills
  • Reusing repeating layouts consistently with configurable slots
  • Installing Progressive Web Apps that launch like native ones
  • Uploading images from a mobile device’s camera
  • Capturing GPS location of a mobile user
Simple Business Processes, App Logic, and Integration
  • Orchestrating app logic with workflows that react to data changes
  • Sending Emails and push notifications
  • Integrating data from MySQL, OData, Fusion Apps, and REST APIs
  • Synchronizing remote data periodically to a local cache
  • Querying based on spatial distances
  • Predicting outcomes from historical data with machine learning
  • Validating parent/child data using simple SQL checks
  • Using semantic similarity searching with 23ai vector search
  • Improving Gen AI results with Retrieval-Augmented Generation
  • Offloading longer-running processing to the background
  • Loading CSV, Excel, or JSON data in foreground or background
  • Enriching remote data with local joins and computations
  • Exposing application data as REST APIs using JSON Duality Views
  • Producing reusable REST API catalogs from OpenAPI documents
Hassle-free Dev Ops and Application Lifecycle
  • Tracking issues and tackling tickets in teams with working copies
  • Merging changes from a separate working copy back to main
  • Testing apps and deploying to test and prod environments
  • Valuing APEX scalability, extensibility, security, and governance

Only Unused Items in Grid LOV

I saw an interesting question in the APEX discussion forum this morning asking how a Popup LOV in an interactive grid could show only the items that were not already referenced in the grid. It’s a question I’d asked myself multiple times before, but one whose answer I hadn’t researched until today…

My solution combines a tip from my colleague Jeff Kemp’s article Interactive Grid: Custom Select List on each row with the get_ig_data plug-in that simplifies using pending grid data in SQL or PL/SQL. Fellow Oracle employee Bud Endress had mentioned the plug-in to me multiple times and I watched the APEX Instant Tips #66: Getting Oracle APEX IG data video with Insum’s Anton Nielsen and Michelle Skamene to learn more. You can download the sample app at the end to try it out yourself.

Overview of the Data Model

The sample uses the following simple data model to create or edit orders for items from an inventory comprised of twenty-six different food items from Apple and Banana to Yuzu and Zucchini.

Data model for the sample app

The simple order create and edit page lets you type in an order comment, and an interactive grid of food items and their quantities. The goal was to have the popup LOV display only the items that aren’t already mentioned in other grid rows. As shown below, if the order being created or edited already includes Banana and Apple then the LOV for another row leaves those out of the list.

Getting JSON Grid Data in a Page Item

The get_ig_data dynamic action plugin copies data from an interactive grid and places it in a JSON format into a page item. I first downloaded the get_ig_data plug-in from here on apex.world, and installed it into my app. Then I created a hidden page item P3_GRID_JSON_CONTENT to contain the JSON. Finally, I added a dynamic action step using the plug-in to execute when the value of the ITEM_ID column in the grid gets changed.

As shown in the figure below, it’s configured to only include the value of the ITEM_ID column in the grid rows and to return the JSON into the (hidden) P3_GRID_JSON_CONTENT page item. Notice that I ensured the Fire on Initialization switch was set to ON so that on page load the JSON would be populated into the hidden page item as well.

Configuring the Get IG Data dynamic action plug-in as an Value Changed action step

Including the JSON in the LOV Query

Initially I left the P3_GRID_JSON_CONTENT page item visible by setting it to be a Display Only item type. This let me study the JSON format the plug-in creates. After selecting Banana and Apple, I saw that the JSON looked like this:

[
  {"ITEM_ID":{"v":"2","d":"Banana"},"INSUM$ROW":1},
  {"ITEM_ID":{"v":"1","d":"Apple"},"INSUM$ROW":2}
]

I noticed that it was an array of JSON objects, each containing an ITEM_ID property for the column I’d configured the plug-in to include. Since the ITEM_ID is an LOV-based column, the plug-in provides the value as another JSON object with v and d properties, giving me access to both the return value and the user-friendly display string. For my purposes, I only needed the return value, so I updated the ITEM_ID column’s Popup LOV SQL Query to look like the statement below. It includes a where id not in (...) clause to elminate the set of item ids we get from the grid JSON document. Using an appropriate json_table() clause in the subselect, I query just the v property of the ITEM_ID property of each row in the JSON.

select name d, id r
from eba_demo_item
where id not in (select item_id
                   from json_table(:P3_GRID_JSON_CONTENT, '$[*]'
                      columns (
                         item_id number path '$.ITEM_ID.v' 
                      )) where item_id is not null)
order by name

Sending Pending Grid Data to the Server

Notice that the LOV SQL Query above references the page item bind variable :P3_GRID_JSON_CONTENT. That hidden page item contains pending edits that might not yet be saved in the database, so we need to ensure that this client-side information is submitted to the server when the Popup LOV performs its request to the server to retrieve its data. This is where the trick I learned from Jeff Kemp’s article came into play. I was unable to find the Page Items to Submit field in the property editor, where I knew I needed to type in P3_GRID_JSON_CONTENT to achieve the result I wanted. His tip involved first setting the Parent Column(s) property to the primary key column name. In my case, this column is named ID. That column won’t be changing, but providing a parent column value “unlocks” the ability to set the Page Items to Submit property. After performing those two steps, the page designed looked like the figure below.

Configuring the Popup LOV SQL Query to return items not already in the grid

This was all that was required to achieve the goal. Unfortunately, I later learned that the original forum question asker was using APEX version 19.1 and verified that the earliest APEX version the get_ig_data plug-in supports is 20.1… d’oh! So while my sample didn’t provide him a ready-to-use solution for APEX 19.1, it did help me learn a few cool new tricks about APEX in the process.

Downloading the Sample

You can download the APEX 23.1 sample app from here and give it a spin for yourself. Thanks again to Jeff, Anton, and Michelle for the useful article and video.

P.S. If the grid may be long or filtered, you might consider augmenting this idea by changing the where id not in (select …) statement to also include the list of existing ITEM_ID values in the EBA_DEMO_ITEM_ORDER_LINES where the ORDER_ID = :P3_ID and then also passing the P3_ID as one of the “Page Items to Submit”.

Simplify Sharing Region Data

I’ve frequently found it useful to share one region’s data in another. For example, as a user narrows her results with a faceted search or smart filter, a chart, map or dynamic content region shows the same results in a different way. My colleague Carsten explains the technique in his Add a Chart to your Faceted Search Page blog post, and it has come in handy for me many times. But after the fifth pipelined table function and object types I authored to enable the data sharing, I set out to automate the process to save myself time in the future. As an APEX developer, the ability to create development productivity apps for yourself is a cool super power!

The Region Data Sharing Helper app featured in this article lets you pick a region from any app in your workspace and easily download scripts to share that region’s results in another region in the same application. After first explaining how to use the app, I highlight some interesting details of its implementation.

Overview

The app lets you select regions for which to generate data sharing artifacts. Since data sharing requires both data and a unique region identifier, the app only shows regions with a static id having a source location of Local Database, REST Enabled SQL, or REST Source. After adding a region to the selected list for artifact generation, if needed you can adjust the columns to include and the base name. Then, you can download the generated artifacts for that region. By incorporating the SQL scripts into your APEX app, you can configure additional regions in the same app to use the original one’s data using the SELECT statement provided in the accompanying README file.

The app maintains the list of selected regions to remember the subset of columns you configure and the base name of the generated artifacts you prefer for each region. If you later update one of the original regions in the App Builder in a way that affects its columns, just click the (Regenerate) button to refresh its datasource info and download the artifacts again.

Choosing a Region

As shown in the figure below, choose a region whose data you want to share with other regions in the same app. Click (Add Region) to add it to the list of selected regions below.

Region Data Sharing Helper app showing Employees region in HR Sample app

Sometimes the selected region is immediately ready for artifact generation, but other times it may take a few seconds to show a status of Ready. If you see a status of Working, as shown below, wait 10 seconds and click the refresh icon to see if it’s ready yet.

Click (Refresh) after 10 seconds if status shows as Working

Once the status of a selected region is Ready, you can adjust the base name and included columns and save any changes. If you’ve modified the original region in your app in a way that affects its data source columns, click Regenerate to refresh the set of available columns to choose from.

Adjusting the included columns and base name as necessary

Once you’ve saved any changes, the download button will reappear. Click it to get a zip file containing the generated SQL scripts and a README file explaining what they are and how to use them.

Clicking the download button to produce the data sharing artifacts

When you no longer anticipate needing to download data sharing artifacts for a selected region, you can remove it from the list of selected ones by clicking the Delete button. This simply removes it from the helper app’s list of selected regions. You can always add it again later as a selected region if the need arises.

Exploring the Downloaded Artifacts

After clicking the download button for the Employees region on page 1 of the HR Sample application shown above, since the Base Name was employees a zip file named employees-region-data-sharing-artifacts.zip is downloaded. Extracting the zip file reveals three generated files as shown below.

Mac finder showing the contents of the downloaded zip file

The README.html is the place to start, since it explains the other two files.

README.html file explains the generated artifacts and suggests SELECT statement to use

The employees_types.sql script defines the employees_row and employees_tab types used by the pipelined table function in the other file. The employees_function.sql defines the employees_data pipelined table function and depends on the types. You can include these scripts directly into your APEX application as Supporting Objects scripts, or add them to the set of your existing installation scripts. Due to the function’s dependency on the types, however, just ensure that the types script is sequenced before the function script.

For example, incorporating the generated SQL scripts into the HR Sample app above as supporting objects scripts would look like this:

Supporting Objects scripts after adding the two data sharing SQL files

Using Pipelined Table Function in a Region

The README file contains a suggested SELECT statement to use as the source of the region where you want to reuse the original region’s data. After running the types SQL script then running the function SQL script, you can try the suggested statement in another region in the same HR Sample application. In the example below, I’ve used it as the source of a chart region on the same page as the original faceted search region.

Using the SELECT statement suggested in the README file in another region in the same app

The query I’ve used appears below, and of course I could leave out columns that are not necessary in the new region. For simplicity, I used the statement verbatim as I found it in the README file:

select ename,
       empno,
       sal,
       comm,
       deptno
  from table(employees_data)

After also configuring a dynamic action on the After Refresh event of the Employees region to declaratively refresh the Salaries chart region, we immediately see the data sharing working in action, reflecting the filtering the current user performs in the original region, too.

HR Sample app showing generated data-sharing artifacts in use to reflect filtered data in a chart

The rest of the article explains some interesting details of the Region Data Sharing Helper app implementation. If you’re primarily interested in trying out the functionality, you’ll find the download link at the end.

Cascading Select Lists for App, Page, Region

An extremely handy consequence of Oracle APEX’s model-driven architecture is that all application metadata is queryable using SQL. By using the APEX dictionary views, it’s incredibly easy to create new APEX applications that introspect application definitions and provide new value. In the case of the Region Data Sharing Helper app, I needed three select lists to let the user choose the application, page, and region for artifact generation. The query for the P1_APPLICATION select list page item appears below. It uses appropriate where clauses to avoid showing itself in the list and to only show applications that have at least one region with a non-null static id configured and a local database, remote database, or REST service data source.

select a.application_name||' ('||a.application_id||')' as name,
       a.application_id
from apex_applications a
where a.application_id != :APP_ID
and exists (select null
              from apex_application_page_regions r
             where r.application_id = a.application_id
               and r.static_id is not null
               and r.location in ('Local Database',
                                  'Remote Database',
                                  'Web Source'))
order by a.application_name

The query for the P1_PAGE select list page item is similar, retrieving only those pages in the selected application having some qualifying region. Notice how the value of P1_APPLICATION is referenced as a bind variable in the WHERE clause:

select page_name||' ('||page_id||')' as name, page_id
from apex_application_pages p
where p.application_id = :P1_APPLICATION
and p.page_function not in ('Global Page','Login')
and exists (select null
              from apex_application_page_regions r
             where r.application_id = p.application_id
               and r.page_id = p.page_id
               and r.static_id is not null
               and r.location in ('Local Database',
                                  'Remote Database',
                                  'Web Source'))
order by p.page_id

By simply mentioning P1_APPLICATION in the Parent Items(s) property of the P1_PAGE select list, the APEX engine automatically handles the cascading behavior. When the user changes the value of P1_APPLICATION, the value of P1_PAGE is reset to null, or its default value if it defines one. It also implicitly submits the value of any parent items to the server when the select list’s query needs refreshing on parent value change. To save the user a click, I’ve defined the default value for P1_PAGE using a SQL query to retrieve the id of the first page in the available list of pages.

The P1_REGION select list page item uses a similar query against the apex_application_page_regions view, listing P1_PAGE as its parent item and providing an appropriate query for the item’s default value to automatically choose the first region in the list whenever the list gets reset by the cascading select list interaction.

Adding Chosen Region to Selected List

When you choose a region and click the (Add Region) button to add it to the list selected for artifact generation, the Add Region to Selected List page process runs. It uses the built-in Invoke API action to call the add_region_to_selected_list() function in the eba_demo_region_data_sharing package. If it’s the first time this combination of app id, page id, and region static id has been added, it inserts a new row in the eba_demo_reg_data_requests table to remember the user’s selection. Then it proceeds to describe the “shape” of the region’s data source: the names and data types of its columns. That info will be recorded in the xml_describe column in this row by a background job. I reveal next why a background job was required…

Describing a Region’s Data Source Profile

No dictionary view provides the names and data types of a region’s datasource in a way that works for all kinds of data-backed regions, so I had to think outside the box. I applied a meta-flavored twist on Carsten’s data-sharing strategy and created a pipelined table function get_region_source_columns() to programmatically fetch the region datasource column metadata I needed using the following approach:

  1. Use apex_region.open_context() on the region in question
  2. Retrieve the column count using apex_exec.get_column_count()
  3. Loop through the columns to discover the name and data type of each
  4. For each one, call pipe row to deliver a row of region column metadata

The complication I encountered was that apex_region.open_context() only works on regions in the current application. However, when the Region Data Sharing Helper app is running, it is the current app in the APEX session. I needed a way to momentarily change the current application to the one containing the region to describe.

I first tried using an APEX automation to run the region describe process in the background. I hoped a call to apex_session.create_session() inside the job could establish the appropriate “current app” context before using apex_region.open_context() to describe the region. However, I discovered the APEX engine already establishes the APEX session for the background automation job, and my attempt to change it to another app id didn’t produce the desired effect.

Carsten suggested trying a one-time DBMS Scheduler job where my code would be the first to establish an APEX session without bumping into the built-in session initialization. Of course, his idea worked great! Things went swimmingly from there. The code I use inside add_region_to_selected_list() to run the DBMS Scheduler one-time background job looks like this:

-- Submit one-time dbms_scheduler job to process the
-- request to describe the region in some app in the
-- workspace other than the current utility app
dbms_scheduler.create_job (
    job_name        => dbms_scheduler.generate_job_name,
    job_type        => 'plsql_block',
    job_action      => replace(c_gen_xml_job_plsql,c_id_token,l_id),
    start_date      => systimestamp,
    enabled         => true,
    auto_drop => true);

The PL/SQL block submitted to the scheduler comes from the c_gen_xml_job_plsql string constant whose value appears below, after substituting the #ID# token with the primary key of the row in eba_demo_reg_data_requests representing the region that needs describing:

begin
  eba_demo_region_data_sharing.describe_region(#ID#);
  commit;
end;

When the background job runs describe_region(12345), that procedure retrieves the application id, page id, and region id from the eba_demo_reg_data_requests table using the id provided, calls create_apex_session_with_nls() to establish the right application context, then calls the xml_for_sql() function in my eba_demo_transform_group package to retrieve an XML document that represents the query results from the following query against the region metadata pipelined table function:

select * 
  from eba_demo_region_data_sharing.get_region_source_columns(
                                     :app_id,
                                     :page_id,
                                     :region_static_id)

It then updates the row in eba_reg_data_requests to assign this XML region column profile as the value of its xml_describe column. This XML document will have the following format:

<ROWSET>
  <ROW>
    <NAME>EMPNO</NAME>
    <DDL_NAME>empno</DDL_NAME>
    <DATA_TYPE>number</DATA_TYPE>
    <DECLARED_SIZE/>
  </ROW>
  <ROW>
    <NAME>ENAME</NAME>
    <DDL_NAME>ename</DDL_NAME>
    <DATA_TYPE>varchar2</DATA_TYPE>
    <DECLARED_SIZE>50</DECLARED_SIZE>
  </ROW>
  <!-- etc. -->
</ROWSET>

If it’s the first time we’re describing this region, it also assigns a default value to the include_columns column to reflect that all columns are selected by default. The situation when it’s not the first time we’re performing the region describe has an interesting twist I explain later when we explore regenerating the artifacts for a region.

Forms with Previous/Next Navigation

The two user-editable fields in the eba_demo_reg_data_requests row are basename and include_columns . The former represents the base name that will be used to generate the name of the object type (basename_row), the collection type (basename_tab), and the pipelined table function (basename_data). The latter is a stored as a colon-separated list of included column positions, relative to the positional order they appear in the xml_describe data profile XML document. Since you can add multiple regions to the selected list, I wanted to let the user page forward and backward through those selected entries.

To implement that row navigation, I learned a new trick by reading an article by my colleage Jeff Kemp. It revealed a neat feature of the APEX Form region that supports easy paging through an ordered set of rows. You configure it with a combination of settings on the form region itself, as well as on its Form – Initialization process in the Pre-Rendering section of the page.

On the form region, you set the data source and make sure to impose a sort order. That’s important to establish a predictable next/previous ordering for the rows the user navigates. For example, in the helper app the form region’s source is the local table eba_demo_reg_data_requests with an Order By Clause of generate_requested_on desc . This ensures the user sees the requests in most recently generated order.

The other half of the setup involves the Form – Initialization process. As shown below, after creating three page items with in-memory-only storage to hold their values, you configure the Next Primary Key Item(s), Previous Primary Key Item(s), and Current Row/Total Item with the respective names of the page items.

Form Initialization process settings for next/previous navigation

Informed by the form region’s source and sort order, along with these navigation related settings, the APEX engine automatically computes the values of these page items when the page renders. I left the P1_REQUEST_COUNT visible on the form as a display only page item so the user can see she’s on region “3 of 5”. I made the other two page items hidden, but referenced their value as appropriate in the Handle Previous and Handle Next branches I configured in my After Processing section of my page’s Processing tab.

I chose to handle the navigation buttons with a Submit Page action combined with branches so the form’s Automatic Row Processing (DML) process would save any changes the user made on the current page before proceeding to the next or previous one. If the form had been read-only, or I didn’t want to save the changes on navigation, the values of P1_NEXT_REQUEST_ID and P1_PREVIOUS_REQUEST_ID could also be referenced as page number targets in buttons that redirect to another page in the current application. Lastly, I referenced these page item values again in the server-side conditions of the NEXT and PREVIOUS buttons so that they only display when relevant.

Using Transform Group to Generate Artifacts

The artifact generation and download is handled declaratively using a transform group, a capability I explain in more detail in a previous blog post. For generating the region data sharing artifacts to be downloaded in a single zip file, I added the following generate-data-sharing-artifacts.xml static application file. It includes a single data transform whose parameterized query retrieves the region’s column names and data types, filtered by the developer’s choice of columns to include in the generated artifacts. The SELECT statement uses the xmltable() function to query the region’s data profile stored in the xml_describe column. This offered me a chance to learn about the for ordinality clause to retrieve the sequential position of the <ROW> elements that xmltable() turns into relational rows. This made it easy to combine with the apex_string.split() function to retrieve only the columns whose sequential position appears in the colon-separated list of include_columns values.

<transform-group directory="{#basename#}-region-data-sharing-artifacts">
    <data-transform>
        <query bind-var-names="id">
            select x.name, x.ddl_name, x.data_type, x.declared_size
            from eba_demo_reg_data_requests r,
            xmltable('/ROWSET/ROW' passing r.xml_describe
                        columns
                        seq           for ordinality,
                        name          varchar2(255) path 'NAME',
                        ddl_name      varchar2(80)  path 'DDL_NAME',
                        data_type     varchar2(80)  path 'DATA_TYPE',
                        declared_size number        path 'DECLARED_SIZE'
            ) x
            where r.id = to_number(:id)
            and x.seq in (select to_number(column_value)
                        from apex_string.split(r.include_columns,':'))
            order by x.seq
        </query>
        <transformation stylesheet="generate-types.xsl" 
                        output-file-name="{#basename#}_types.sql"/>
        <transformation stylesheet="generate-function.xsl" 
                        output-file-name="{#basename#}_function.sql"/>
        <transformation stylesheet="generate-readme.xsl" 
                        output-file-name="README.html"/>                                          
     </data-transform>
</transform-group>

The transform group includes three transformations that each use an appropriate XSLT stylesheet to transform the region data profile information into a SQL script defining the object types, a SQL script defining the pipelined table function, and a README.html file.

Replacing Strings in XSLT 1.0 Stylesheets

XSLT 2.0 has a replace() function that works like Oracle’s regexp_replace(), but the Oracle database’s native XSLT processor implements only the XSLT 1.0 feature set. Therefore, we need an alternative to perform string substitution in a stylesheet that generates an artifact by replacing tokens in a template.

For example, the generate-readme.xsl stylesheet in the helper app defines a variable named query-template with an example of the SQL query you’ll use to select data from the pipelined table function. This template contains a token #COLUMNS# that we’ll replace with the comma-separated list of selected column names. It also has #FUNCNAME# token we’ll replace with the name of the pipelined table function.

<xsl:variable name="query-template">select #COLUMNS#
  from table(#FUNCNAME#)</xsl:variable>

After first computing the value of the variable columns by using an <xsl:for-each> to loop over the names of the selected columns, the stylesheet performs the double token substitution while defining the example-query variable. If we were able to use XSLT 2.0, the example-query variable definition would look like this:

<!-- XSLT 2.0 string replace example -->
<xsl:variable name="example-query"
  select="replace(replace($query-template,'#COLUMNS#',$columns),
                  '#FUNCNAME#',$function-name)"/>

However, as mentioned above we need to limit our stylesheets to functionality available in XSLT 1.0 to use the native Oracle database XSLT processor. Instead, we use nested calls to a named template replace-string. Think of a named XSLT template like a function that accepts parameters as input and returns an output. So, the following example-query variable declaration calls the replace-string named template to replace the token #FUNCNAME# in the value of the stylesheet variable query-template with the value of the stylesheet variable named function-name:

<!-- Partial solution, replace first #FUNCNAME# token -->
<xsl:variable name="example-query">
   <xsl:call-template name="replace-string">
     <xsl:with-param name="text" select="$query-template"/>
     <xsl:with-param name="replace">#FUNCNAME#</xsl:with-param>
     <xsl:with-param name="with" select="$function-name"/>
   </xsl:call-template>
</xsl:variable>

But the result of the above would be the query template with only the #FUNCNAME# token replaced, leaving the #COLUMNS# token intact. XSLT variables are immutable: once assigned their value cannot be updated. So we are not allowed to create multiple, consecutive <xsl:variable> statements that update the value of the same example-query variable, replacing one token at a time. Instead, XSLT relies on nested calls to the replace-string function while performing the initial (and only allowed) assignment of the example-query variable. So after calling the replace-string template once to replace #FUNCNAME# with the value of $function-name, we use that result as the value of the input text parameter in a second, outer call to replace-string to swap #COLUMNS# with the value of $columns like this:

<!-- Final solution, replace #FUNCNAME#, then #COLUMNS# -->
<xsl:variable name="example-query">
  <xsl:call-template name="replace-string">
    <xsl:with-param name="text">
      <xsl:call-template name="replace-string">
        <xsl:with-param name="text" select="$query-template"/>
        <xsl:with-param name="replace">#FUNCNAME#</xsl:with-param>
        <xsl:with-param name="with" select="$function-name"/>
      </xsl:call-template>
    </xsl:with-param>
    <xsl:with-param name="replace">#COLUMNS#</xsl:with-param>
    <xsl:with-param name="with" select="$columns"/>
  </xsl:call-template>
</xsl:variable>

The generate-types.xsl and generate-function.xsl stylesheets perform this same nested invocation of replace-string, but have more tokens to substitute. As expected, this results in more deeply-nested calls. However, the concept is the same as this two-token example from generate-readme.xsl.

Vertically Centering the Add Region Button

When a button appears in the same row of a form as other page items, by default its vertical alignment with respect to its “row mates” doesn’t look as eye-pleasing as it could.

A button’s default vertical alignment in a row with other page items

The trick to improve the button’s visual appeal, is to add the CSS class u-align-self-center to the Column CSS Classes property in the Page Designer like this:

Using u-align-self-center to vertically center button with page items in the same row

Show Buttons Based on Row Existence

I wanted the user to see an (Add Region) button if the region they choose is not yet in the selected list, and instead see a (Regenerate) button if the region is already in the list. And I wanted the correct button to show both when the page initially renders, as well as when the user changes the values of the select list interactively. I implemented this feature using a dynamic action with conditional hide and show action steps based on an existence check query.

As shown below, I started by using drag and drop in the Page Designer’s Layout editor to drag the (Regenerate) button into the same grid cell as the (Add Region) button. Since the user will see only one or the other at a time, they both can occupy that same grid cell just to the right of the P1_REGION select list.

Two buttons stacked in the same grid cell since the user will see only one or the other at runtime

Next, I added a dynamic action on the Change event of the P1_REGION page item. Recall that in the helper app, being in the selected list means that a row exists in the eba_demo_reg_data_requests table with the region’s unique combination of application id, page id, and region static id. The first action step in the dynamic action event handler uses Execute Server-side Code to run the following query that always returns a row with either ‘Y‘ or ‘N‘ into the hidden P1_REGION_IN_SELECTED_LIST page item. This provides the info about whether the region exists in the list or not.

with region_in_selected_list as (
    select max(id) as id 
      from eba_demo_reg_data_requests
     where app_id = :P1_APPLICATION
       and page_id = :P1_PAGE
       and region_static_id = :P1_REGION
)
select case 
         when x.id is null then 'N' 
         else 'Y' end
into :P1_REGION_IN_SELECTED_LIST
from region_in_selected_list x;

Then I followed that action step with four conditional steps that use a client-side condition based on the value Y or N to hide the button that needs hiding and show the button that needs showing. Notice how the new action step name can be very useful in making the steps self-documenting with a more descriptive label than the old “Hide” or “Show” that appeared before 22.2.

Dynamic action on P1_REGION change event to hide/show appropriate buttons

To finish the job, I set the Fire on Initialization switch to true for the four Hide/Show action steps, and provided the same existence SQL query as the default value of the P1_REGION_IN_SELECTED_LIST hidden page item. This ensured that the correct button shows both during the initial page render, as well as after the user interactively changes the region select list.

To Defer or Not to Defer (Rendering)

With the above configuration in place, the appropriate (Add Region) or (Regenerate) button was appearing conditionally as desired. However, I noticed that when the page first rendered I would momentarily see both buttons flash before the inappropriate one for the currently selected region would get hidden by my dynamic action. The solution to avoid the user’s seeing this “behind the scenes” page setup behavior is to enable the Deferred Page Rendering template option shown below. This setting allows you to decide when faster, incremental page rendering is more appropriate, or whether APEX should wait until page-load-time dynamic behavior is complete before revealing the final state of the page to the user.

Deferred Page Rendering option hides page-load-time hide and show activity

Preserving Column Selection on Regeneration

When you click the (Regenerate) button for a region you’ve already added to the selected list, the add_region_to_selected_list() function updates the existing eba_demo_reg_data_requests row to set READY = ‘N‘ and it runs the background job to call describe_region() again. The region might have changed the set of available columns since the previous time we described it, but the user may have carefully decided which of the previous region’s columns to include and exclude. So it’s important for usability to retain the included columns across the region data profile regeneration.

At the moment the describe_region() code has produced the fresh region data profile XML document and is about to update the existing row in eba_demo_reg_data_requests, we have the following “ingredients” available to work with:

  1. The old xml_describe region profile XML document
  2. The old include_columns value with a colon-separated list of index positions relative to the old region profile XML document
  3. The new region profile XML document just produced

What we need to “bake” with these ingredients is a new list of included columns that retains any columns that were previously in the included list while ignoring any of those included columns that are no longer available to reference. Also worth considering is that the index positions of the previous column names might be different in the new region data profile XML document.

After initially writing the code using multiple loops in PL/SQL, I challenged myself to come up with a single SQL statement to accomplish the job. In words, what I needed the statement to do was, “select a colon-separated list of index positions relative to the new XML describe document where the column name is in the list of names whose whose index positions (relative to the old XML describe document) were in the colon-separated list currently stored in include_columns .” I adjusted the query to also handle the situations when the old XML document was null and when the list of include_columns was null. This let me use the same routine to calculate the default value for the include_columns list for both new and updated rows in eba_demo_reg_data_requests. The private get_default_included_columns() function in the eba_demo_region_data_sharing package has the SELECT statement I use to tackle the job.

select listagg(x.seq,':') within group (order by x.seq)
into l_ret
from xmltable('/ROWSET/ROW' passing p_new_xml_describe
        columns 
            seq for ordinality,
            name varchar2(128) path 'NAME') x
    where p_old_xml_describe is null
        or
        x.name in (
    select y.name
        from xmltable('/ROWSET/ROW' 
                passing p_old_xml_describe
                columns 
                    seq for ordinality,
                    name varchar2(128) path 'NAME') y
        where p_before_list is null 
            or y.seq in (
            select to_number(column_value)
                from apex_string.split(p_before_list,':'))); 

Conclusion

This was a fun learning project that taught me many new things about Oracle APEX in the process of building it. Always keep in mind that Oracle APEX is built with Oracle APEX, and that you, too, can use APEX to build yourself any kind of development productivity helper app you can imagine, not to mention plug-ins of all kinds to extend the core functionality of the platform. Thanks to colleagues Carsten, Jeff, and Vlad who offered me tips on aspects of this sample.

Getting the Sample Apps

You can download the Oracle APEX 22.2 export of the Region Data Sharing Helper app from here. In case you’re interested in the HR Sample app used to show off the generated artifacts in action, you can download that from here. The latter requires that you’ve first installed the EMP/DEPT sample dataset from the Gallery. Enjoy the simplified data sharing!

Declarative Data-Driven Downloads

While developing APEX apps, on multiple occasions I’ve needed to generate data-driven artifacts for external use. My app lets staff manage the data that drives their organization, but for historical reasons a related public-facing website can’t be replaced in the near term. The site is usually static files or was built years before on a different tech stack like LAMP (Linux, Apache, MySQL, PHP). This article walks through a simple example of generating all the HTML files for a static website based on database data. It uses a declarative “transform group” capability I wrote for myself to combine the declarative power of SQL, XML, and XSLT to generate and download a zip file of generated artifacts. See the README file that accompanies this article’s sample app to learn more about how transform groups can be applied in your own APEX apps.

Background Motivation

One APEX app I built as a “nerd volunteer” for a non-profit in Italy required generating:

  • HTML pages for a conference schedule in a particular format
  • SQL scripts to update another system’s MySQL database
  • JSON files to import into an auth provider’s user management console
  • PHP source code files to “drop in” to an online portal site

For example, the conference schedule data shown in the APEX app screenshot in the banner above, turns into a static HTML file to display the parallel tracks of the conference program like this:

Static conference program HTML file generated from data managed by an APEX app

A Favorite Technology Trio: SQL + XML + XSLT

For anyone who may have read my O’Reilly book Building Oracle XML Applications published in October 2000, it should come as no surprise that I find the combination of SQL, XML, and XSLT stylesheets very useful. Your mileage may vary, but over the intervening years I have generated many data-driven artifacts using this trio of technologies. It only made sense that I’d reach for them again as APEX became my tool of choice for building new applications over the past few years.

While each distinct task of generating data-driven artifacts is slightly different, the high-level similarities shared by all tasks I’ve had to implement involve:

  • A SQL query to produce XML-formatted system-of-record data
  • One or more XSLT stylesheets to transform the XML data into appropriate text-based artifact files

The Oracle database natively supports generating XML from any SQL query results and transforming XML using XSLT (version 1.0) stylesheets. After learning the APEX_ZIP package makes it easy to generate zip files, I devised a generic facility to use in my current and future APEX apps called “transform groups”.

Defining a Transform Group

I use an XML file to declaratively define the “interesting bits” that make each transform task unique, and include this file along with the XSLT stylesheets required to generate the artifacts as static application files in my APEX app. My “transform group processor” package interprets the transform group file and processes the data transforms in it to download a single zipfile containing all the results. This way, with a single click my apps can produce and download all necessary generated artifacts.

For example, consider the following basic transform group definition file. It defines a single data transform whose SQL query retrieves the rows from the familiar DEPT table and uses the home-page.xsl stylesheet to produce the index.html home page of a hypothetical company directory website.

<!-- generate-hr-site.xml: Transform Group definition file -->
<transform-group directory="hr-site">
    <data-transform>
        <query>
            select deptno, dname, loc
             from dept
        </query>
        <transformation stylesheet="home-page.xsl" 
                        output-file-name="index.html"/>
     </data-transform>
</transform-group>

The in-memory XML document representing the results of the data transform’s query looks like this:

<ROWSET>
  <ROW>
    <DEPTNO>10</DEPTNO>
    <DNAME>ACCOUNTING</DNAME>
    <LOC>NEW YORK</LOC>
  </ROW>
  <!-- etc. -->
  <ROW>
    <DEPTNO>40</DEPTNO>
    <DNAME>OPERATIONS</DNAME>
    <LOC>BOSTON</LOC>
  </ROW>
</ROWSET>

The XSLT stylesheet referenced in the <transformation> element looks like the example below. It contains a single template that matches the root of the XML document above, then uses the <xsl:for-each> to loop over all the <ROW> elements to format a bulleted list of departments.

<!-- home-page.xsl: XSLT stylesheet to generate home page -->
<xsl:stylesheet version="1.0"
     xmlns:xsl="http://www.w3.org/1999/XSL/Transform">
  <xsl:output method="html"/>
  <xsl:template match="/">
    <html>
      <body>
        <h1>Departments</h1>
        <ul>
          <xsl:for-each select="/ROWSET/ROW">
            <li>
                <xsl:value-of select="DNAME"/>
                (<xsl:value-of select="LOC"/>)
            </li>
          </xsl:for-each>
        </ul>
      </body>
    </html>
  </xsl:template>
</xsl:stylesheet>

When viewed in a web browser, the index.html file it produces will looks like this:

HTML home page showing department data

After saving the transform group XML file and corresponding XSLT stylesheet to our static application files, we’re ready to wire up the transform group download.

Wiring Up a Transform Group Download Button

You’ll typically call the transform group’s PL/SQL API from an APEX application process with a process point of “Ajax Callback”. For example, if we create an application process named Download_Static_Website, its code will invoke the download() procedure like this:

eba_demo_transform_group.download(
     p_file_name    => 'generate-hr-site.xml', 
     p_zipfile_name => 'hr-website.zip');

A button or link in your APEX app can initiate the transform group zipfile download. Its link target will redirect to the current page and have the Request parameter in the Advanced section of the link definition set to APPLICATION_PROCESS=Download_Static_Website

With these elements in place, clicking on the button will download an hr-website.zip file containing a single hr-site/index.html file.

Enhancing the Transform Group Definition

A data transform can process the same SQL query results using multiple, different stylesheets. XSLT stylesheets can accept parameters to influence their output, and the data transform supports an optional <parameter-query> element whose SQL query can return rows to provide values of these XSLT parameters. The column-to-parameter-map attribute defines how a column in the parameter query’s value should map to the name of an XSLT parameter. The transform group processor runs the stylesheet once for each row in the parameter query’s results. On each iteration it maps the XSLT parameter to the corresponding column value in the current parameter query row and runs the transformation to produce an output file. Notice that the output-file-name attribute can also reference parameter names as part of the file name.

<!-- generate-hr-site.xml: Transform Group definition file -->
<transform-group directory="hr-site">
    <data-transform>
        <query>
            select deptno, dname, loc
             from dept
        </query>
        <transformation stylesheet="home-page.xsl" 
                        output-file-name="index.html"/>
       <transformation stylesheet="dept-page.xsl" 
                       output-file-name="dept_{#depid#}.html">
            <parameter-query column-to-parameter-map
                                 ="DEPTNO:depid">
                select deptno from dept
            </parameter-query>
        </transformation>
     </data-transform>
</transform-group>

To generate a page for each employee in each department, we can further enhance the transform group to include a nested set of EMP table rows for each DEPT table row, and add a third <transformation> element to generate the employee pages.

<!-- generate-hr-site.xml: Transform Group definition file -->
<transform-group directory="hr-site">
    <data-transform>
        <query>
            select deptno, dname, loc, 
                   cursor( select empno, ename, job 
                            from emp 
                           where deptno = d.deptno) as staff
             from dept d
        </query>
        <transformation stylesheet="home-page.xsl" 
                        output-file-name="index.html"/>
        <transformation stylesheet="dept-page.xsl" 
                        output-file-name="dept_{#depid#}.html">
            <parameter-query column-to-parameter-map
                              ="DEPTNO:depid">
                select deptno from dept
            </parameter-query>
        </transformation>
        <transformation stylesheet="emp-page.xsl" 
                        output-file-name="emp_{#empid#}.html">
            <parameter-query column-to-parameter-map
                                 ="DEPTNO:depid,EMPNO:empid">
                select empno, deptno from emp
            </parameter-query>
        </transformation>
     </data-transform>
</transform-group>

Next we make appropriate updates to home-page.xsl to generate hyperlinked department names and upload the dept-page.xsl and emp-page.xsl stylesheets to our static application files. After this, clicking on the button now downloads the entire company directory static website in the hr-website.zip file. It contains an hr-site top-level directory with all the generated HTML pages as shown in the Finder screenshot below after extracting the zip file contents.

Mac Finder showing contents of downloaded hr-website.zip file

Exploring the Sample App

The APEX 22.2 sample application you can download from here installs the eba_demo_transform_group package and includes a working example of the declaratively-generated website download explained in this article. After importing the sample and ensuring you have the EMP/DEPT sample dataset installed, just click the Generate and Download Static Site button. The sample has tabs to easily explore the syntax of the transform group XML file and accompanying XSLT stylesheets, too. Its README page provides more tips on how transform groups might be useful to your own APEX apps in the future.

Since XSLT transformations are great at declaratively generating text-based artifacts of any kind, hopefully I won’t be the only APEX developer to benefit from the productivity the transform group functionality offers.

Screenshot of sample application that accompanies this article

Data-Driven Diagrams

I often want to visualize my Oracle APEX app’s data model as an Entity/Relationship diagram to remind myself how tables are related and exactly how columns are named. After recently stumbling on the open source Mermaid JS project, I had a lightbulb moment and set out to build my own data model visualizer app with APEX itself.

Mermaid Diagram Syntax

The Mermaid JS open source project aims to improve software documentation quality with an easy-to-maintain diagram syntax for Markdown files. The typical README.md file of a software project can include an Entity/Relationship diagram by simply including text like this:

erDiagram
DEPT ||--|{ EMP : "Works In"
EMP ||--|{ EMP : "Works For"

Including a diagram like this into your product doc is as simple as shown below:

Adding a Mermaid diagram to a Markdown file

If your markdown editor offers a WYSIWYG experience, the effect is even more dramatic and productive: you immediately see the results of the diagram you’re editing. For example, editing a Mermaid diagram in a readme file using Typora looks like this:

Editing a Mermaid diagram in a WYSIWYG Markdown editor like Typora

Popular source control repository sites like GitHub and GitLab have also embraced Mermaid diagrams. Since Markdown is used to provide check-in comments, on these sites (and others like them) it’s easy to include Mermaid diagrams in the helpful summaries you provide along with every commit.

Mermaid’s Diagram Types and Live Editor

Mermaid supports creating many different kinds of diagrams, each using a simple text-based syntax like the ER diagram above. At the time of writing, supported diagram types include Entity/Relationship, Class, Gantt, Flow, State, Mindmap, User Journey, Sequence, Git branch diagrams, and pie charts. The handy Mermaid Live site provides a “sandbox” editor experience where you can experiment with all the different kinds of diagrams, explore samples, and instantly see the results.

Mermaid Live editor for experimentation at https://mermaid.live

For example, after consulting their excellent documentation, I immediately tried including column details into my ER diagram for the DEPT table as shown below:

Mermaid Live editor showing ER diagram with column info and library of diagram samples

Rendering Mermaid Diagrams in Web Pages

To maximize the usefulness of the diagrams, the Mermaid project provides a simple JavaScript API to incorporate scalable vector graphics (SVG) renderings of text-based diagrams into any web page or web application. After referencing the Mermaid JS library URL, including a diagram into a page in my APEX application took a truly tiny amount of JavaScript: one line to initialize the library and one line to render the diagram from the text syntax.

In order to reference the current version of the Mermaid JS library on my page, I typed this URL into my page-level JavaScript > File URLs property:

https://cdnjs.cloudflare.com/ajax/libs/mermaid/9.3.0/mermaid.min.js

Then, after including a Static Content region in my page and assigning it a Static Id of diagram, the two lines of JavaScript code I added to the page-level Execute When Page Loads section looked like this:

mermaid.initialize();
mermaid.mermaidAPI.render('diagramsvg',
    `erDiagram
    DEPT ||--|{ EMP : "Works In"
    EMP ||--|{ EMP : "Works For"`,
    (svg) => {
    document.getElementById('diagram').innerHTML = svg;
});

These two lines of “When Page Loads” JavaScript do the following:

  1. Initialize the Mermaid library
  2. Render the diagram defined by the text passed in as an SVG drawing
  3. Set the contents of the diagram region to be this <svg id="diagramsvg"> element.

In no time, my APEX page now displayed a text-based Mermaid ER diagram:

APEX page including a Mermaid ER diagram based on its text-based syntax

Generating Mermaid Diagram Syntax from a Query

After proving out the concept, next I tackled generating the appropriate Mermaid erDiagram syntax based on the tables and relationships in the current APEX application schema. I made quick work of this task in a PL/SQL package function diagram_text() that combined a query over the USER_CONSTRAINTS data dictionary view with another query over the USER_TABLES view.

The USER_CONSTRAINTS query finds the tables involved in foreign key constraints as a “child” table, and gives the name of the primary key constraint of the “parent” table involved in the relationship. By joining a second time to the USER_CONSTRAINTS table, I can query both child and parent table names at once like this:

  select fk.table_name as many_table, 
         pk.table_name as one_table
    from user_constraints fk
    left outer join user_constraints pk
                 on pk.constraint_name = fk.r_constraint_name
   where fk.constraint_type = 'R' /* Relationship, a.k.a. Foreign Key */

The USER_TABLES query, using an appropriate MINUS clause, finds me the tables that aren’t already involved in a “parent/child” relationship above. By looping over the results of these two queries and “printing out” the appropriate Mermaid ER diagram syntax into a CLOB, my diagram_text() function returns the data-driven diagram syntax for all tables in the current schema.

I ultimately decided to include some additional parameters to filter the tables based on a prefix (e.g. EBA_DEMO_CONF), to control whether to include column info, and to decide whether common columns like ID, ROW_VERSION, and audit info should be included or not. This means the final PL/SQL API I settled on looked like this:

create or replace package eba_erd_mermaid as
    function diagram_text(p_table_prefix    varchar2 := null, 
                          p_include_columns boolean := false, 
                          p_all_columns     boolean := false )
    return clob;
end;

Wiring Up the Data-Driven Diagram

With the diagram_text() function in place, I added a hidden CLOB-valued page item P1_DIAGRAM to my page, added a P1_TABLE_PREFIX page item for an optional table prefix, and added two switch page items to let the user opt in to including column information.

Next, I added the computation to compute the value of the hidden P1_DIAGRAM page item using the diagram_text() function:

eba_erd_mermaid.diagram_text(
  p_table_prefix    => :P1_TABLE_PREFIX,
  p_include_columns => :P1_INCLUDE_COLUMNS = 'Y',
  p_all_columns     => :P1_ALL_COLUMNS = 'Y')

Lastly, I adjusted the “When Page Loads” JavaScript code to use the value of the P1_DIAGRAM hidden page item instead of my hard-coded EMP/DEPT diagram syntax:

mermaid.initialize();
mermaid.mermaidAPI.render('diagramsvg',
    apex.items.P1_DIAGRAM.value,
    (svg) => {
    document.getElementById('diagram').innerHTML = svg;
});

With these changes, I saw the instant database diagram I’d been dreaming of.

The Mermaid library handles the layout for a great-looking result out of the box. The diagram helped remind me of all the tables and relationships in the APEX app I wrote to manage VIEW Conference, Italy’s largest annual animation and computer graphics conference. It’s one of my volunteer nerd activities that I do in my spare time for fun.

Mermaid ER diagram of all tables in current schema matching prefix EBA_DEMO_CONF

However, when I tried installing my ER Diagram app in another workspace where I’m building a new app with a much larger data model, I realized that the default behavior of scaling the diagram to fit in the available space was not ideal for larger schemas. So I set out to find a way to let the user pan and zoom the SVG diagram.

SVG Pan Zoom

Luckily, I found a second open source project svg-pan-zoom that was just what the doctor ordered. By adding one additional JavaScript URL and one line of “When Page Loads” code, I quickly had my dynamically rendered ER diagram zooming and panning. The additional library URL I included was:

https://bumbu.github.io/svg-pan-zoom/dist/svg-pan-zoom.min.js

The extra line of JavaScript code I added to initialize the pan/zoom functionality looked like this:

var panZoom = svgPanZoom('#diagramsvg');

The combination of Mermaid JS and this SVG pan/zoom library puts some pretty impressive functionality into the hands of APEX developers for creating useful, data-driven visualizations. Even for developers like myself who are not JavaScript experts, the couple of lines required to jumpstart the libraries’ features is easily within reach.

With this change in place, now visualizing larger diagrams including showing column information was possible.

Dream #2: Reverse Engineer Quick SQL

Since I sometimes create APEX apps based on existing tables, a second schema-related dream I had was to reverse-engineer Quick SQL from the current user’s tables and relationships. This would let me quickly add additional columns using a developer-friendly, shorthand syntax as new application requirements demanded them. Googling around for leads, I found a 2017 blog article by Dimitri Gielis that gave me a headstart for the code required. Building on his original code, I expanded its datatype support and integrated it with my table prefix filtering to add a second page to my application that produces the Quick SQL syntax for the tables in the current schema.

Quick SQL syntax reverse-engineered from existing schema’s tables and relationships

I expanded the eba_erd_mermaid package to include an additional quicksql_text() function for this purpose:

create or replace package eba_erd_mermaid as
    function diagram_text(p_table_prefix    varchar2 := null, 
                          p_include_columns boolean := false, 
                          p_all_columns     boolean := false )
    return clob;
    function quicksql_text(p_table_prefix varchar2 := null)
    return clob;
end;

Copying Text to the Clipboard

As a last flourish, I wanted to make it easy to copy the Mermaid diagram text syntax to the clipboard so I could easily paste it into the Mermaid Live editor if necessary. And while I was at it, why not make it easy to also copy the Quick SQL text syntax to the clipboard to paste into APEX’s Quick SQL utility?

After searching for a built-in dynamic action to copy the text of a page item to the clipboard, I ended up looking for an existing plug-in to accomplish that functionality. I found an aptly-named APEX Copy Text to Clipboard dynamic action plugin from my colleague Ronny Weiss to get the job done easily with a few clicks of declarative configuration.

APEX, SQL & Open-Source JavaScript for the Win!

In short order, by using APEX to combine the power of the SQL that I know and some minimal JavaScript (that I don’t!), I was able to build myself two dream productivity tools to improve my life as an APEX developer in the future.

If you want to give the sample application a spin, download the APEX 22.2 application export from here. It installs only a single supporting PL/SQL package, so any tables you visualize with it will be your own.

Further Reading

For a full-featured, web-based ERD modeling solution from Oracle, make sure to check out the Data Modeler in SQL Developer Web.

Postscript (December 2024, Update)

My colleague Stefan Dobre helped me recently to repackage the Mermaid JS integration as an APEX plug-in and I reworked the diagram generation logic into helper code in the same plug-in. This avoids the app from needing to install any supporting objects at all. You can check out this more modular See DB application (APEX 23.2 export) that uses this plug-in if interested.

Finding & Fixing Unindexed Foreign Keys

A colleague Martin showed me a cool feature of Oracle APEX this week to find missing foreign key indexes. Under SQL WorkshopUtilitiesObject Reports, a number of helpful reports offer insights about your application’s database objects. As shown by the arrow in the figure below, one of these is the Unindexed Foreign Keys exception report.

SQL Workshop ⟶ Utilities ⟶ Object Reports Page

Clicking on this report type shows a list of any foreign keys missing an index.

SQL Workshop ⟶ Utilities ⟶ Object Reports ⟶ Unindexed Foreign Keys Report

This useful result highlighted a number of opportunities to potentially improve the performance of my application. However, as I continue to find, Oracle APEX has an ace up its sleeve. Notice the (Create Script) button in the report toolbar. Clicking on that button created the SQL script shown below to create all the missing indexes.

Automatically created SQL script to create missing foreign key indexes

One additional click on the (Run) button and all my missing indexes were a thing of the past!

As with so many things I’m discovering about Oracle APEX, getting things done ’tis but the work of a moment as Rowan Atkinson’s store clerk character said in a family favorite film Love Actually